


U.S. Debt, The Good, the Bad and the Ugly in Real Time
Economics / US Debt Nov 30, 2009 - 01:07 PM GMTBy: Frank_Holmes

 Anyone who has visited New York has probably seen The National Debt Clock, a digital readout of how much the federal government owes its creditors. The speed at which that number grows is daunting.
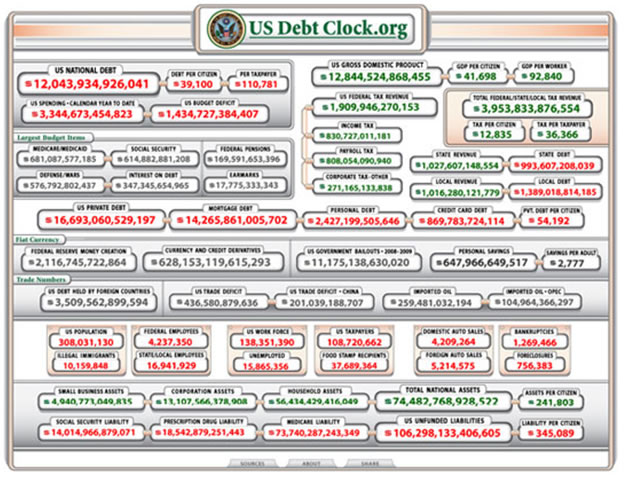
A more comprehensive monitor can be found online at USDebtClock.org. Not only do you get the total national debt of $12 trillion (and rising), you also get a raft of other key economic trend data for the country and its citizens based on information gathered from reputable sources that include the Census Bureau, Treasury Department, Federal Reserve and the Congressional Budget Office.
On the day before Thanksgiving, I checked this web site in the morning and then again on Friday morning, and I’d like to share a few observations about what happened during these two days.
The Fed printed up more than $10 billion in new money over that period, or more than $200 million per hour. Any wonder why gold remains an attractive asset class and our overseas trading partners are wary of the dollar?
The national debt grew by nearly the same amount, with each taxpayer’s share of that burden going up $65 to $110,781. The federal budget deficit rose by $9 billion, and total unfunded liabilities shot up almost $30 billion to $106.3 trillion, or $345,088 per citizen. We’ve commented in the past on how federal deficits have historically been positive for gold and especially gold equities.
Looking at the largest federal budget outlays: More than $5 billion went out the door for Medicare/Medicaid, $4 billion in Social Security benefits, $3.6 billion for national defense and the war efforts in Iraq and Afghanistan, and more than $2 billion in interest payments on the national debt.
One worthwhile feature of the USDebtClock.org is that it tells a fuller story by making room for good economic news.
Gross domestic product in the United States grew by nearly $200 billion, or $1,600 per worker, and about $40 billion in value was added to the total national assets during the two days.
And we also see evidence that, while the federal government continues to strap on heaps more debt, the citizenry is going in the other direction.
About $4 billion in private debt was paid down – most of that was in mortgages, reflecting the prolonged weakness in housing, but more than $1 billion in personal debt and $700 million in credit card debt went away. Personal savings climbed by more than $1 billion over the two days as Main Street continues deleveraging after years of free spending.
You can get to the U.S. Debt Clock by clicking on the image at the top of this commentary. I encourage you to pay a visit – there aren’t many places where you can get so much useful and important economic information at a single glance.
By clicking the link, you will be directed to USDebtClock.org. U.S. Global Investors does not endorse all information supplied by this website and is not responsible for its content. All opinions expressed and data provided are subject to change without notice. Some of these opinions may not be appropriate to every investor.
By Frank Holmes, CEO , U.S. Global Investors
Frank Holmes is CEO and chief investment officer at U.S. Global Investors , a Texas-based investment adviser that specializes in natural resources, emerging markets and global infrastructure. The company's 13 mutual funds include the Global Resources Fund (PSPFX) , Gold and Precious Metals Fund (USERX) and Global MegaTrends Fund (MEGAX) .
More timely commentary from Frank Holmes is available in his investment blog, “Frank Talk”: www.usfunds.com/franktalk .
Please consider carefully the fund's investment objectives, risks, charges and expenses. For this and other important information, obtain a fund prospectus by visiting www.usfunds.com or by calling 1-800-US-FUNDS (1-800-873-8637). Read it carefully before investing. Distributed by U.S. Global Brokerage, Inc.
All opinions expressed and data provided are subject to change without notice. Some of these opinions may not be appropriate to every investor. Gold funds may be susceptible to adverse economic, political or regulatory developments due to concentrating in a single theme. The price of gold is subject to substantial price fluctuations over short periods of time and may be affected by unpredicted international monetary and political policies. We suggest investing no more than 5% to 10% of your portfolio in gold or gold stocks. The following securities mentioned in the article were held by one or more of U.S. Global Investors family of funds as of 12-31-07 : streetTRACKS Gold Trust.
Frank Holmes Archive |
© 2005-2022 http://www.MarketOracle.co.uk - The Market Oracle is a FREE Daily Financial Markets Analysis & Forecasting online publication.