


Crude Oil and Value of Technical Analysis
Commodities / Crude Oil Sep 16, 2007 - 12:36 PM GMTBy: Joseph_Russo

Before we get to our weekly briefing on the major market indices, we thought it appropriate to explore the following:
What value might traders and investors place on technical market analysis?
The answer depends upon a few basic variables.
Firstly, what do we mean by technical market analysis?
In short, professionally drafted technical analysis is a forward-looking, graphical assessment tool that anticipates bi-directional value-levels of a price-series over a given time horizon.
To be clear, we are not speaking of a “trade recommendation service” but rather an impartial forecasting platform designed to empower traders and investors with a basic knowledge of charting, trading-skills, and decision-making abilities.
Secondly, to set such a value, one must ask to what degree the source of analysis is reliable, accurate, and consistent with one's specific trading preferences, and tolerance for risk.
Finally, one must know to what extent one can expect to consistently profit from such analysis.
After the crude presentation that follows, we shall leave the final answer to such question in the hands of each reader, and then conclude with our brief market summary.
Tuesday July 31, 2007 (MAINSTREAM HEADLINES)
CRUDE OIL UP ANOTHER 1.8% HEADING FOR $80.00
Tuesday July 31, 2007 ELLIOTT WAVE TECHNOLOGY'S ( Near Term Outlook )
CRUDE OIL poised to fall
As Crude approached record highs six weeks ago, we provided Near Term Outlook clients with the chart above.
At the time, we clearly illustrated that Crude Oil was over-extended, mature in its multiple extension of wave-progressions, and had breached a resting upside capture-window in trading through its threshold at the 78.18 level.
In this July report, we had alerted our clients that there was solid justification for probing the short side of Crude and fading the sessions near 2% rally against the $78.00 high.
Three weeks later crude was down by over $9.00 per barrel or 11%, which translates to more than $9,000.00 in profits for each futures contract traded!
Not only does the follow-up chart below graphically depict a most extraordinary and profitable outcome to our analysis from late July, it carries additional forward-looking analysis for what came directly afterward.
Tuesday August 21, 2007 (MAINSTREAM HEADLINES)
CRUDE OIL IN FREE-FALL, PLUNGES ANOTHER 2% likely heading back to $60.00
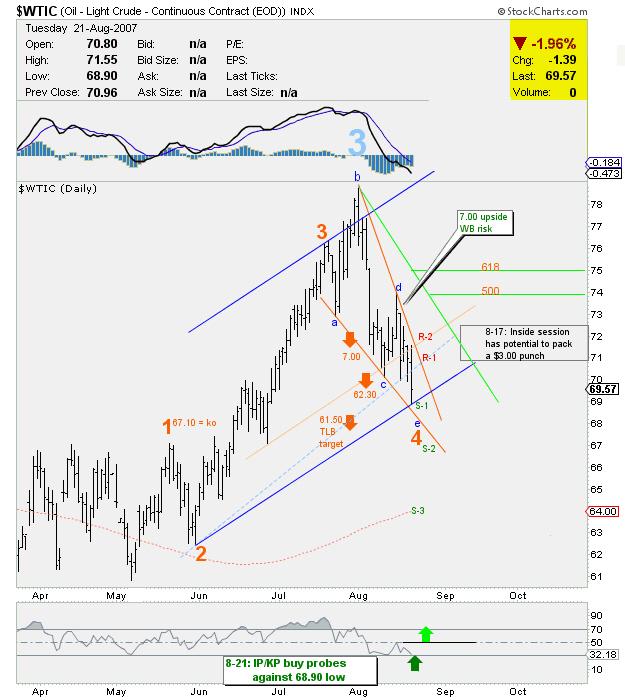
Tuesday August 21, 2007 ELLIOTT WAVE TECHNOLOGY'S ( Near Term Outlook )
Bubbling Crude - ready to rise
After plunging precipitously for the first three weeks August, our August 21 report for Crude was essentially anticipating bottom to a 4th wave down, and included a secondary follow-up issuance of a BUY SIGNAL against a 68.90 low.
As we all know by last Thursday September 13, just three short-weeks from our call to reverse long, and BUY CRUDE at $69.00, Oil closed at 78.78 – up 9.78 or 14.17%.
The Bottom Line (remember the initial valuation question…)
Those of our clients trading futures earned upwards of $18,000.00 per contract basis this back-to-back forecast!
Those trading 2 contracts earned $36,000.00, and those trading more than two contracts made more money in six weeks than the majority of middle-class Americans earn over the course on an entire year!
Conservative clients trading the non-leveraged (USO) oil-fund ETF had opportunity to earn in excess of 28% returns in six short-weeks! A non-leveraged ETF trade yielded clients $2,800.00 in profit for each multiple of 10K invested.
Most fund managers would be thrilled to achieve such numbers over the course of an entire year let alone six weeks - we just delivered such performance metrics in less than two months!
The price is right
As stated earlier, we shall leave it to each reader to determine what value one might place on such analysis. Feel free to share your opinions should you wish. COME ON DOWN!
While pondering the above, let's take a look at last weeks broad market performance.
The Week in Review:
NASDAQ 100
The NDX:
Hope is on the move!
Heading into the fifth week off the low, it is all up to Ben and friends deliver the anticipated goods sufficiently enough to launch the NDX toward 2100 and better.
Overall, the entire financial sphere faces quite a quandary in moving toward its next plateau. The platform from which it steps will likely show itself by weeks-end.
Now testing 15-year lows, The Dollar remains under pressure and awaits its near-term fate from the almighty Fed later in the week.
Although not quite as confident, The Dow also covets high levels of hope for new bailout highs.
Gold followed through nicely upon breaking out of its long consolidation. Technically, Gold is a bit stretched – fundamentally, its still way undervalued in our view.
Although The S&P remains in “float-mode,” it will require a further dose of sustainable hope to launch, and keep it above the short-term down trendline at which it presently knocks.
Should readers have interest in obtaining access to Elliott Wave Technology's blog-page, kindly forward the author your e-mail address for private invitation.
Visitors to the blog are encouraged to browse all of the page-archives to acquire a better sense of our unique brand of analysis and forecasting services.
Until next time …
Trade Better / Invest Smarter...
By Joseph Russo
Chief Editor and Technical Analyst
Elliott Wave Technology
Copyright © 2007 Elliott Wave Technology. All Rights Reserved.
Joseph Russo, presently the Publisher and Chief Market analyst for Elliott Wave Technology, has been studying Elliott Wave Theory, and the Technical Analysis of Financial Markets since 1991 and currently maintains active member status in the "Market Technicians Association." Joe continues to expand his body of knowledge through the MTA's accredited CMT program.
Joseph Russo Archive |
© 2005-2022 http://www.MarketOracle.co.uk - The Market Oracle is a FREE Daily Financial Markets Analysis & Forecasting online publication.