


US Now in Growth Recession, Full Blown Recession Tomorrow?
Economics / US Economy Sep 18, 2007 - 12:55 AM GMTBy: Paul_L_Kasriel

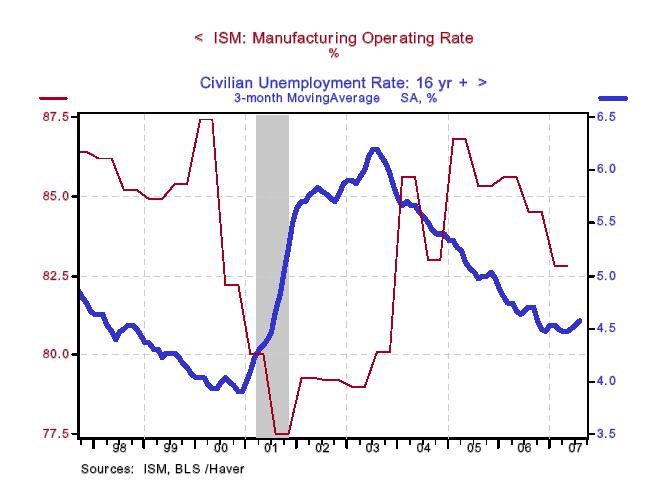
 On a year-over-year basis, growth in real gross domestic product (GDP) is settling in at around 2%. Although the economy's precise potential growth rate is unknown, most estimates center around 2-3/4%. Therefore, it is safe to say that the economy currently is growing below its potential growth rate and is likely to continue so in the foreseeable future. This situation is sometimes referred to as a growth recession. As economic growth persists below potential, the unemployment rate begins edging higher and the manufacturing capacity utilization (operating) rate begins moving lower. Chart 1 shows that these events are beginning to occur now.
Chart 1
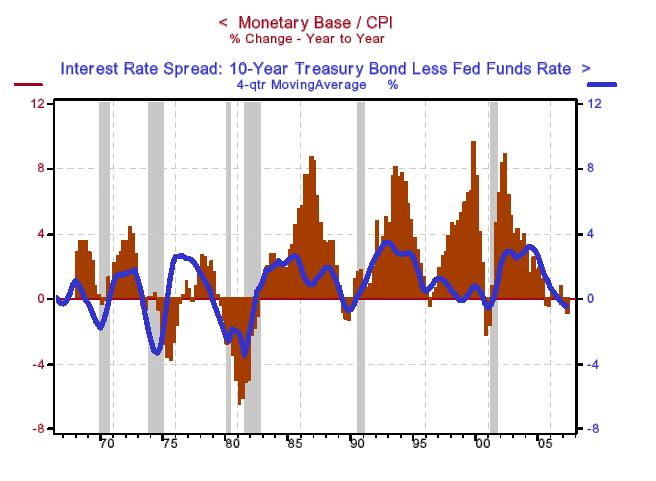
What are the probabilities that this growth recession morphs into a full-fledged recession? The probabilities are high. Let's start by looking at what we have immodestly called the “Kasriel Recession Warning Indicator” (KRWI). (For discussions about the KRWI see, LEI and KRWI - It's Different This Time? , When The Facts Change, I Change My Model - What Do You Do? , Recession Imminent? Both the LEI and the KRWI are Flashing Warning , and The Inverted Yield Curve - Is It Really Different This Time? ). The KRWI is the combination of the year-over-year change in the real (CPI-adjusted) monetary base (the monetary base consists of the reserves created by the Fed and the coin and currency held by the nonbank public) and the four-quarter moving average of the spread between the yield on the Treasury 10-year security and the federal funds rate. Every recession since that of 1970 has been preceded by or accompanied by a contraction in the real monetary base and a negative interest-rate spread. In both the first and second quarters of this year the KRWI has qualitatively signaled an imminent recession. The quantitative signal strength, however, was still relatively weak.
Chart 2
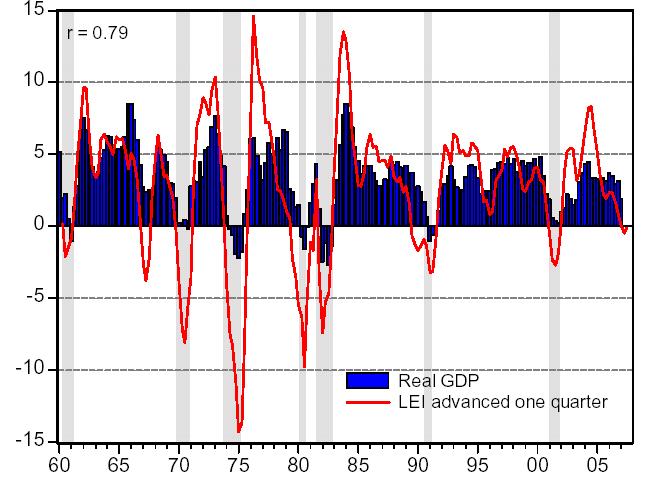
A weak recession signal is being sent by the Conference Board's index of Leading Economic Indicators (LEI). Year-over-year contractions in the quarterly average of the LEI typically have heralded recessions. Since 1960, the LEI has issued only one false signal, in 1967 (see Chart 3). In the first and second quarters of 2007, the year-over-year changes in the LEI were -0.5% and -0.1%, respectively. Similar to the KRWI, the LEI is sending a qualitative recession signal, but the quantitative signal strength still is weak.
Chart 3
Index of Leading Economic Indicators (LEI) vs. Real GDP
year-to-year percent changes
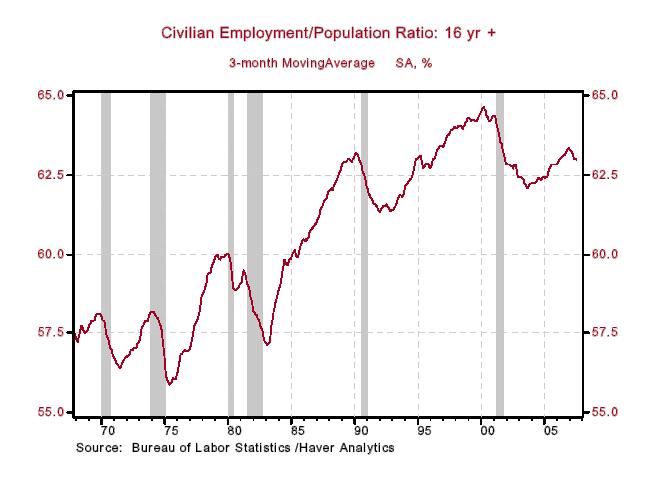
Employment measures tend to be coincident rather than leading indicators of cyclical economic behavior. One relatively reliable employment measure is the employment-to-population ratio. This measures the number of people employed relative to the number of people who potentially could be in the labor force. Typically, when the trend in the employment-to-population ratio turns down, the economy already has entered a recession or is about to (see Chart 4). It appears as though the employment-to-population ratio has recently entered a downtrend.
Chart 4
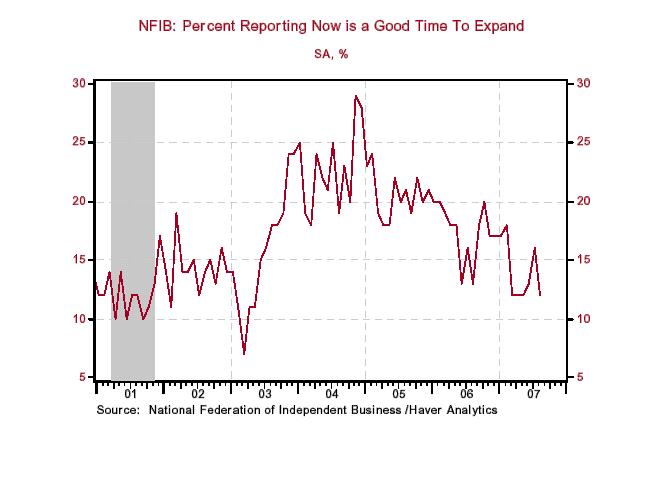
While on the subject of employment indicators, we would like to discuss one that seems un reliable to us – nonfarm payrolls. The principal reason we find it unreliable is the so-called birth/death adjustment the bean counters at the Bureau of Labor Statistics (BLS) make each month. The birth/death adjustment is an attempt to account for the net new jobs created by businesses not yet reporting to the BLS. As Chart 5 shows, in the 12 months ended August 2007, there had been a net increase in nonfarm payrolls, including the birth/death adjustment, of 1.521 million. But when the birth/death adjustment was excluded , the net increase in nonfarm payrolls was only 407,000. Another way to look at this is to calculate the birth/death adjustment's percentage contribution to the 12-month change in total nonfarm payrolls. Chart 6 shows that in the 12 months ended August 2007 the birth/death adjustment represent 73% of the increase in nonfarm payrolls compared to only 31% in March 2006. Enquiring minds want to know why the birth/death adjustment's contribution has more than doubled since March 2006. With small businesses expressing reservations about expanding their operations (see Chart 7), is it reasonable to expect that there has been a sharp increase in business start-ups whose hiring is not being captured in the BLS's sample of establishments?
Chart 5
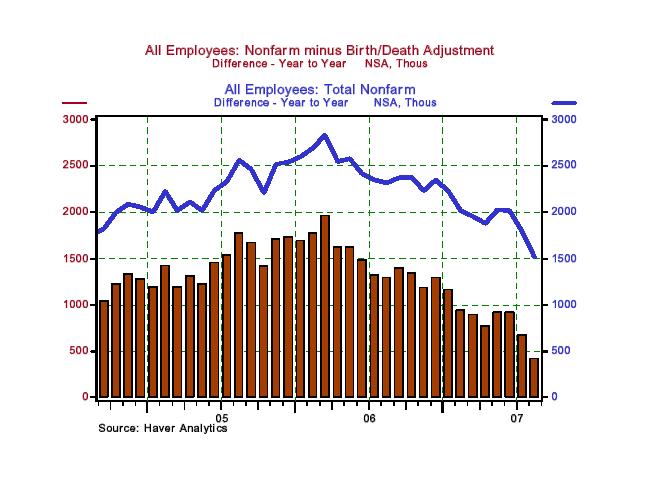
Chart 6
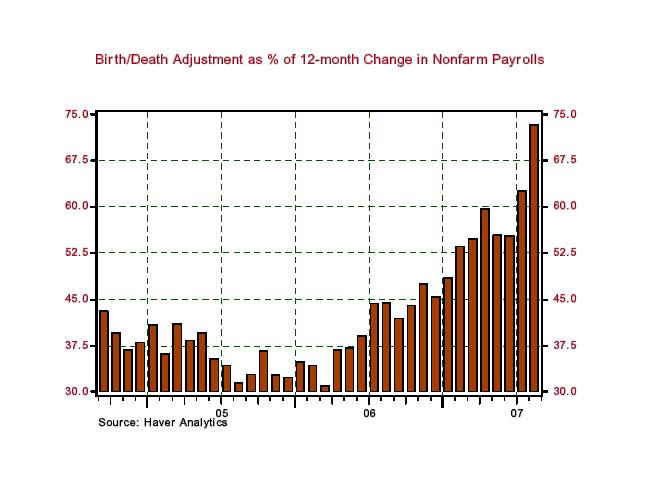
Chart 7
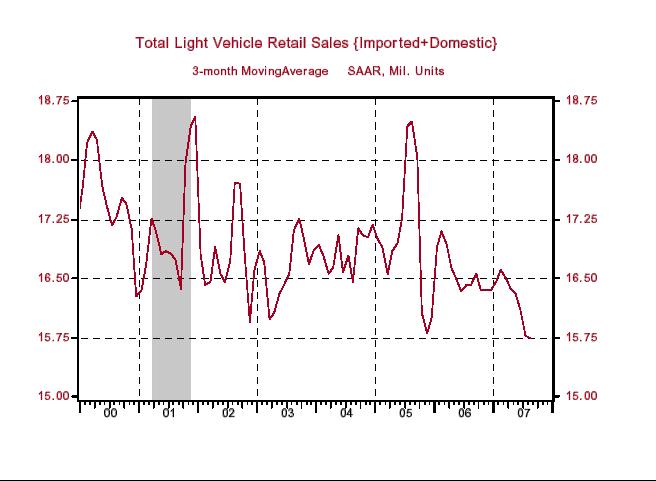
It is clear that the ongoing housing recession is spreading to consumer spending, especially discretionary items. Chart 8 shows that light motor vehicle sales have downshifted in 2007, slowing to an annualized rate of 15.75 million units in the three months ended August vs. 16.54 million units sold in all of 2006. Is there a more discretionary item than a Harley Hog? Harley-Davidson has reported a slowdown in its domestic sales. Brunswick Corporation is reporting weakness in its marine (recreational watercraft) division.
Chart 8
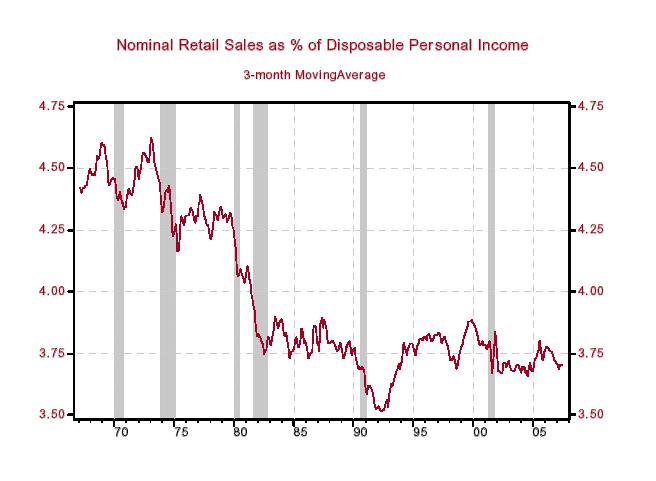
The trend rate of growth in nominal retail sales has definitely turned lower, as shown in Chart 9. Part of this slower growth in nominal retail sales relates to the slowdown in the rate of increase of gasoline prices. But if nominal gasoline purchases are accounting for a smaller proportion of our after-tax income, why aren't we using our “savings” at the pump to increase our non-energy purchases? Because households are getting more cautious in their spending. Chart 10 shows that before recessions start, households typically start to cut back on their nominal retail spending relative to their nominal after-tax income. This why the common refrain that “so long as household income and employment are growing, consumer spending and economic growth will be OK” is nonsense. The Conference Board seems to know what very few mainstream economic analysts do not know – household income and employment are coincident indicators, not leading indicators. So, current growth in income and employment tell us little about future growth in income, employment and GDP.
Chart 9
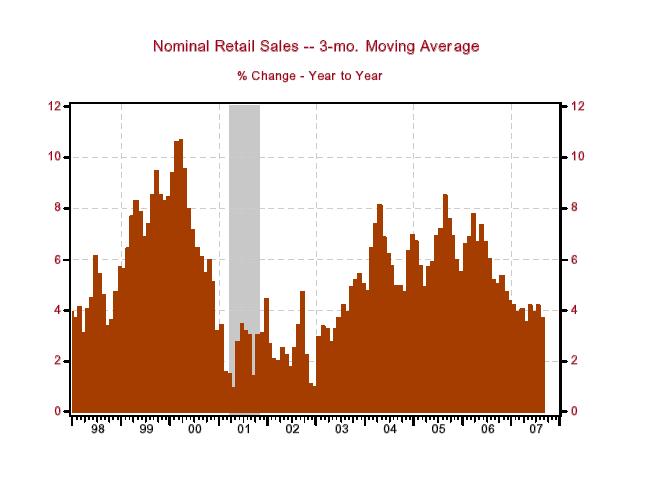
Chart 10
In sum, the U.S. economy has entered, at best, a growth recession – an environment in which excess capacity will begin to rise in the labor and product markets. In turn, this excess capacity will temper price increases of good and services, and most likely equity prices, too. At worst, the U.S. economy is on the cusp of entering a full-fledged recession. Either way, the Federal Open Market Committee (FOMC) will start cutting its target for the federal funds rate. We expect the first funds rate target cut of 25 basis points to occur at the FOMC meeting on September 18. This will just bring the fed funds rate target down to the 5% level the actual fed funds rate has been averaging over the several weeks (see Chart 11). Even though the FOMC's target funds rate would just come into line with the actual level of the funds rate, by cutting its target the FOMC would be sending a signal to market participants that a return to a 5.25% actual fed funds rate level is not being contemplated.
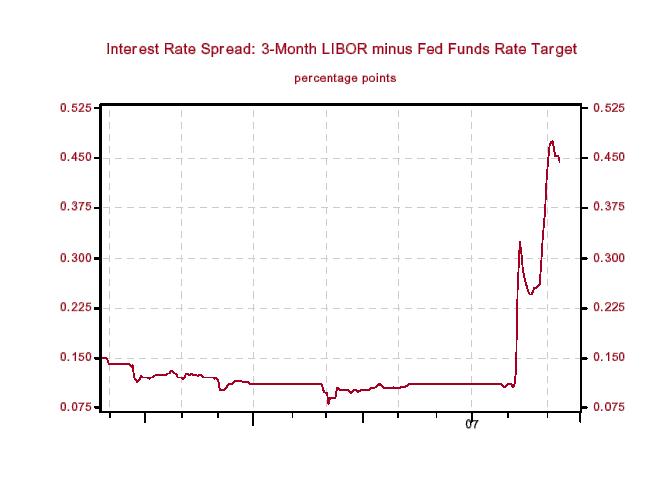
The Federal Reserve Board also might get more creative by reducing further the spread of the discount rate over the federal funds rate – currently at 50 basis points. By cutting the discount-rate spread, the Federal Reserve Board might be able to bring down the rate on 3-month London Interbank lending, so-called 3-month LIBOR. In recent weeks, 3-month LIBOR has been trading about 45 basis points over the fed funds rate target vs. about 11 basis points higher prior to the recent financial market turmoil (see Chart 12). LIBOR is an important interest rate inasmuch as it serves as a base lending rate for many private lending contracts. We see the September 18 cut in the FOMC's fed funds rate target as the first in a series. We anticipate that the target funds rate will have fallen to a level of 4.25% after the January 30, 2008, FOMC meeting – 100 basis points lower than where it is today.
The risk case is that the fed-funds-rate target will be even lower than 4.25% on January 30 or in the immediate months thereafter.
Chart 11
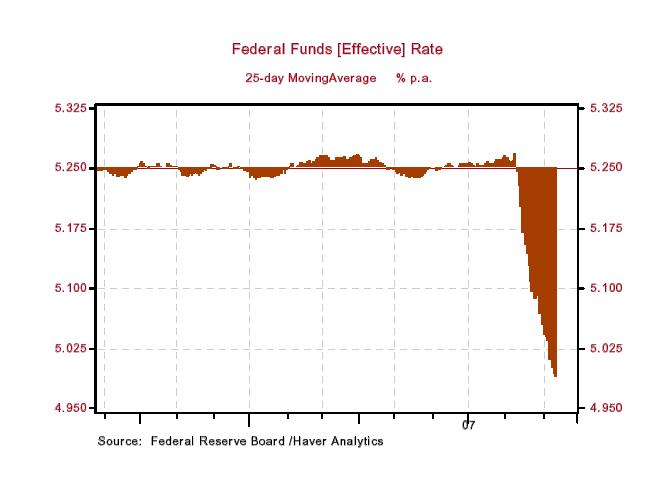
Chart 12
THE NORTHERN TRUST COMPANY
ECONOMIC RESEARCH DEPARTMENT
September 2007
SELECTED BUSINESS INDICATORS
Table 1 US GDP, Inflation, and Unemployment Rate
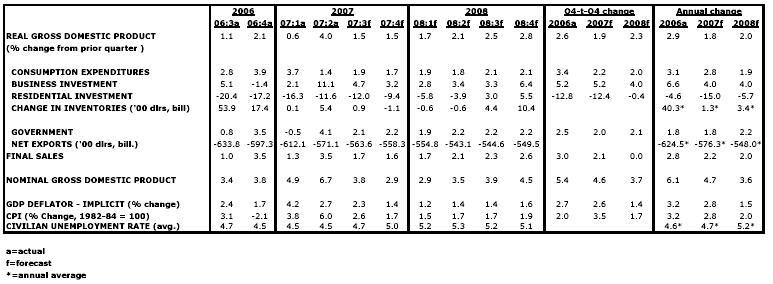
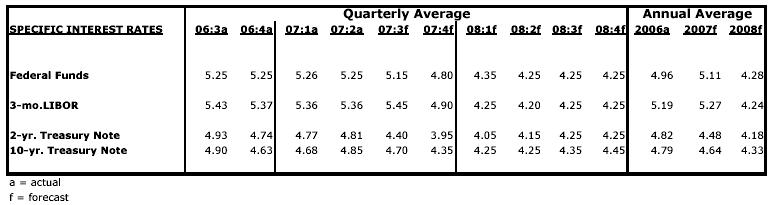
Table 2 Outlook for Interest Rates
*Paul Kasriel is the recipient of the 2006 Lawrence R. Klein Award for Blue Chip Forecasting Accuracy
By Paul L. Kasriel
The Northern Trust Company
Economic Research Department - Daily Global Commentary
Copyright © 2007 Paul Kasriel
Paul joined the economic research unit of The Northern Trust Company in 1986 as Vice President and Economist, being named Senior Vice President and Director of Economic Research in 2000. His economic and interest rate forecasts are used both internally and by clients. The accuracy of the Economic Research Department's forecasts has consistently been highly-ranked in the Blue Chip survey of about 50 forecasters over the years. To that point, Paul received the prestigious 2006 Lawrence R. Klein Award for having the most accurate economic forecast among the Blue Chip survey participants for the years 2002 through 2005.
The opinions expressed herein are those of the author and do not necessarily represent the views of The Northern Trust Company. The Northern Trust Company does not warrant the accuracy or completeness of information contained herein, such information is subject to change and is not intended to influence your investment decisions.
Paul L. Kasriel Archive |
© 2005-2022 http://www.MarketOracle.co.uk - The Market Oracle is a FREE Daily Financial Markets Analysis & Forecasting online publication.