


Stock Market Turns - Short-Term Outlook
Stock-Markets / Cycles Analysis Sep 19, 2007 - 02:30 PM GMTBy: Jim_Curry

 Current SPX Index Positions:
Mid-term (6-8 weeks) = BULLISH; 40% long @1448.96
Short-term (1 day-3 weeks) = NEUTRAL
From previous outlook: “we may be able to make some assumptions on what lies ahead for the next few days. First, we do have the outstanding upside target to 1491 SPX CASH or higher for the 10-day cycle, which does favor a higher high still out there for the short-term. Secondly, the current 10 and 20 day up phase that began off of last Monday's bottom would have the best ‘look' for a higher high above 1496.40 to materialize.
That is, if the larger 45, 120, 360 day cycle positioning is correct then the probabilities will favor that the 45 day component will see it's peak with the second 20-day up phase that is contained within it; that second 20-day up phase is the current rotation. In other words, as long as the 1439.29 swing low from last week holds any near-term downside, then the expectation has to be for a higher high above 1496.40 to be out there somewhere.”
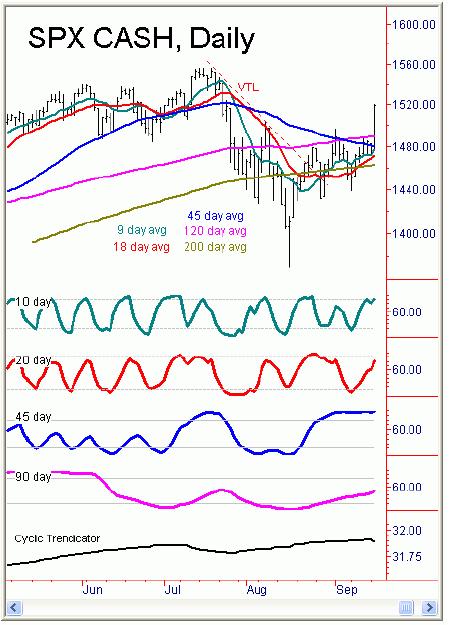 Current analysis: The SPX spent most of the session in an upside consolidation heading into the 2:15 PM news announcement. The fed cut .50 points with the fed funds rate - and also .50 with the discount rate - which was a surprise to the markets, sending the indexes firmly higher off the same into late-day trading, here running all the way up to 1519.88 at the session peak. Volume here came in at an expansion of 46% from yesterday's levels. And, coming on a day where a higher high was registered, this is viewed as a continued short-term bullish indication with technicals as we head into Wednesday.
From the cyclic table (above), the 10-day cycle component is now seen as 6 days along and has flipped to a neutral labeling at Tuesday's close. The larger 20-day cycle is now seen as 6 days along and still viewed as bullish, while the even-larger 45-day cycle is now seen as 22 days along and is still regarded as bullish. The larger 120-day cycle is now seen as 22 days along and is labeled bullish, while the 360-day cycle is currently seen as 130 days along and thus is also still labeled as bullish into at least November of this year.
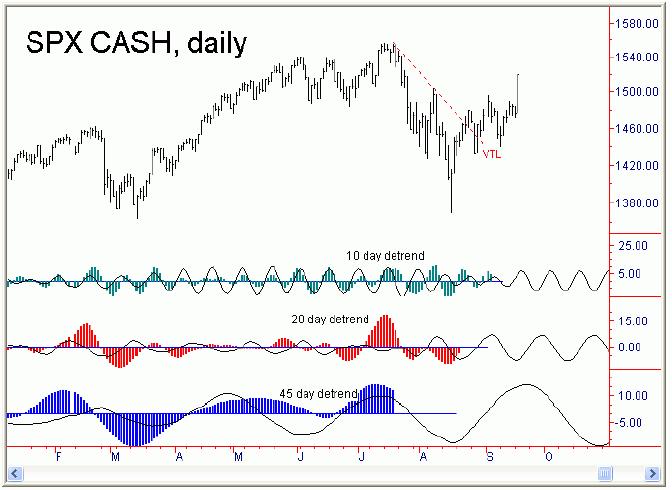
As per the notes from last night regarding price, the probabilities favored a move to and ideally above the 1496.40 swing top that was seen on 9/4/07. As well, today's action also satisfied the current upside projection from the 10 day cycle component to 1491-1504, which was originally given last week. Thus, we can now say that all of the price and time analysis in regards to both the 10 and 20 day components has been met with Tuesday's action. With this said and noted, the same probabilities are favoring that at least a short-term peak is forming at or near current levels. At minimum, we are due for another 10-day cycle down phase (with the current cycle now 6 days along), which should take prices down to the 1470-1480's or lower.
However, there is the better-than-average shot that both the 20 and 45 day cycles could also be peaking in the current timeframe, which - if seen - would end up correcting the entire move up off the 1370 swing low, once complete. Either way, looking for a short-term high to form here, to be followed by a correction back down to the 1470's-1480's or lower by the 25th-26th, which is where the next 10 day cycle bottom is set to low-out. We'll see how that down phase plays itself out and then reassess the odds for a larger correction as we move along; stay tuned.
NASDAQ 100 CASH
 Current NDX Index Positions:
Mid-Term (4-8 weeks) = BULLISH; 75% long @1926.15
Short-term (1 day - 3 weeks) = NEUTRAL; EXITED LONGS @2035.37 (today's close)
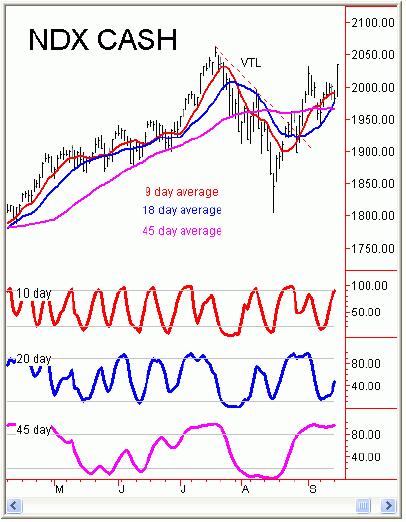
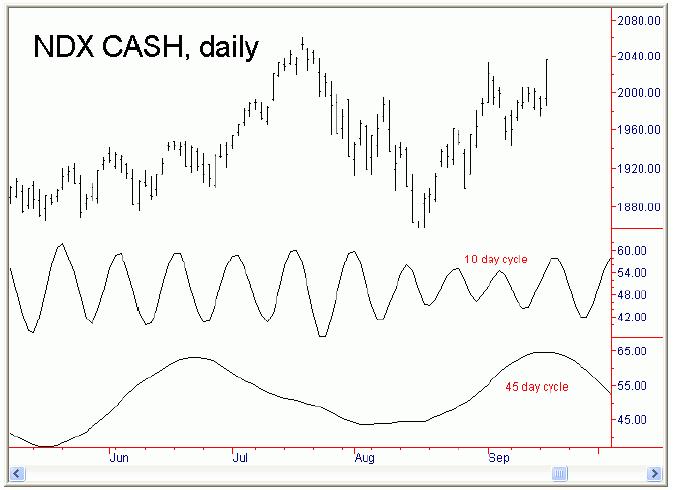
From previous outlook: “As per the notes from recent days, the 10 and 20 day up phases are favored to be in force off of last Monday's 1943 swing low - and, providing the same holds any new downside in the days ahead, then the probabilities will favor a move to or (ideally) above the recent swing top of 2032.10. Otherwise, any breach of the same 1943 level - if seen - would have to favor something bigger in progress, such as our larger 45-day cycle down phase already in play.”
Current analysis: As per the recent notes on volume for both the SPX and NDX, the technical indications were tilted to the bullish side in Tuesday's session. Like the SPX, the NDX saw an early consolidation to the upside heading into the fed news at 2:15 PM. Once that news was released, price then shot to the upside into later in the day, here running all the way up to a high of 2035.37 at the session peak - and ending right at the highs for the session. Volume here came in at an expansion of 50% from yesterday's levels. And, coming on a day where a higher high was registered, this is still viewed as short-term bullish and favors higher highs still out there.
As per the notes from recent days, the probabilities favored a move to or (ideally) above the 2032 level on the current swing up with the 10 and 20 day cycles. That analysis was thus satisfied in Tuesday's session - and also has taken us out of our recent short-term bullish/long position on this index at today's close (2035.37), originally taken at the 1958.25 level a week or so back.
With the above then said and noted, we should now be looking for a short-term peak with at least the 10-day cycle here - but with decent-odds that a peak is also forming with the larger 20 and 45-day components. A minimum correction back down to the 1980-1990 region should be seen with the 10 day component, though I am going to suggest that the odds are decent that a correction all the way back down to the 1900-1930's could materialize before all is said and done. Even with both of the above, with the earlier notes regarding volume the probabilities will favor that any correction will come from a higher high than today's 2035.37 high. Stay tuned.
By Jim Curry
Market Turns Advisory
email: jcurry@cycle-wave.com
website: http://www.cycle-wave.com
Jim Curry is the editor and publisher of Market Turns advisory, which specializes in using cyclical analysis to time the markets. To be added to our mailing list click HERE
Disclaimer - The financial markets are risky. Investing is risky. Past performance does not guarantee future performance. The foregoing has been prepared solely
for informational purposes and is not a solicitation, or an offer to buy or sell any security. Opinions are based on historical research and data believed reliable,
but there is no guarantee that future results will be profitable. The methods used to form opinions are highly probable and as you follow them for some time you
can gain confidence in them. The market can and will do the unexpected, use the sell stops provided to assist in risk avoidance. Not responsible for errors or
omissions. Copyright 1998-2007, Jim Curry
JIm Curry Archive |
© 2005-2022 http://www.MarketOracle.co.uk - The Market Oracle is a FREE Daily Financial Markets Analysis & Forecasting online publication.