


Stock Market Appears Attractive Over Next 6-to-12 Months
Stock-Markets / Stock Markets 2011 Jan 19, 2011 - 08:12 AM GMTBy: Chris_Ciovacco

 Our market models at CCM continue to paint a positive outlook for stocks, and risk assets in general, over the next twelve months. Positive fundamental data and global growth projections averaging 4.3% for the coming year continue to outweigh concerns about sovereign issues in Europe, a U.S. housing market weighed by continued foreclosures, and high unemployment.
A read of this morning’s news aligns well with a positive stock market outlook. The Wall Street Journal reported the number of manufacturing jobs in the U.S. in 2010 grew 1.2%, or 136,000, the first increase since 1997, with another rise is expected in 2011. U.K. jobless claims unexpectedly dropped in December to the lowest level in 21 months.
A Bloomberg article makes the case recent gains in commodity prices are nothing to be concerned about:
The increases are “largely a reflection of the fact that the pace of economic growth, particularly in the U.S., has picked up,” said Nariman Behravesh, chief economist at consultants IHS in Lexington, Massachusetts, and a former Federal Reserve official who has been covering the global economy for more than 35 years. “It’s not something to be worried about.”
We find it interesting a former Fed official would fail to mention the role of the Federal Reserve’s printing presses in helping push commodity prices higher. The Bloomberg article continues with:
“High commodity prices are the result of rising demand, not the cause of future economic weakness,” Darda said. “Over the last decade, commodity prices and the U.S. stock market have usually moved together.” He sees the Standard & Poor’s 500 Index rising to 1,425 this year from 1,295.02 at 4 p.m. in New York yesterday as the economy grows by about 4 percent.
One of the primary drivers of stocks and commodities moving in tandem over the past decade is the Fed’s boom and bust policies, which continually tinker with the money supply. As we described on October 26, 2010, the Fed’s quantitative easing program (QE2) pumps cash into the hands of sovereign wealth funds, primary dealers, and hedge funds. While we agree commodities have moved in part due to increasing fundamental demand, we must respect the added risk and role played by speculative demand, and those looking for paper currency alternatives. A sound market has a good balance between fundamental and speculative demand. Over the last decade, the speculative side of the equation has become increasingly important relative to the fundamental side, which means risk management tools have also become increasingly important.
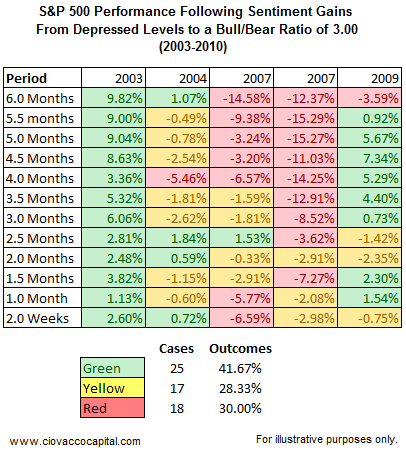
While stocks appear attractive over the next six-to-twelve months, extended sentiment and approaching overhead resistance could set the market up for a much-needed correction in the neighborhood of 3% to 5%. There were 57.3% Bulls versus 19.1% Bears as of 1/12/11, according to the weekly Investors Intelligence survey of stock market newsletter advisors, putting the bull/bear ratio at 3.00. We examined five recent cases similar to the present day, where sentiment rose from depressed levels to a bull/bear ratio of 3.00 (2003, 2004, 2007 [twice], and 2009). The S&P 500’s performance following these periods is shown in the table below. Additional detail on sentiment can be found in our January 14th comments.
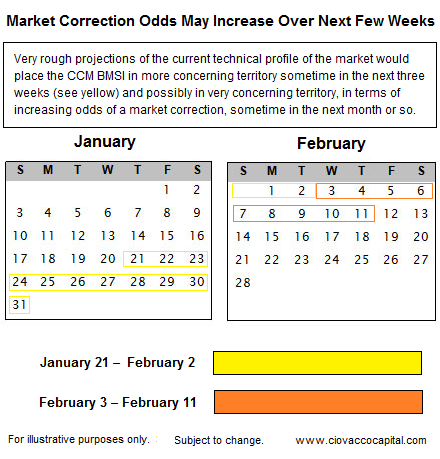
The extended technical state of the markets will need to be cleared at some point over the coming weeks. Our market models, along with historical market data, enable us to make some guesstimates regarding when a pullback may begin. Recently, we used the CCM Bull Market Sustainability Index (BMSI) and some back-of-the envelope calculations to project future BMSI levels, based on current BMSI levels and recent trends in numerous technical indicators. This type of projection is not used to make decisions today, but it does help us better prepare for possible chess moves over the next few weeks. This is a planning exercise, not an execution exercise.
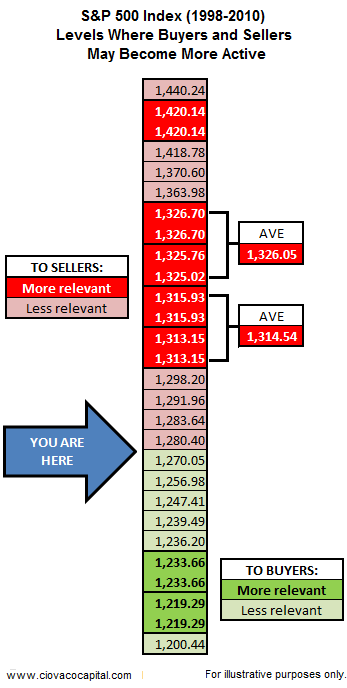
It is possible sentiment and extended technical conditions will converge as the S&P 500 approaches some key historical levels. The table below, presented on January 6th, remains relevant and tells us to pay attention as the S&P 500 approaches 1,314 and 1,326; areas representing logical points for sellers to become more interested in booking gains.
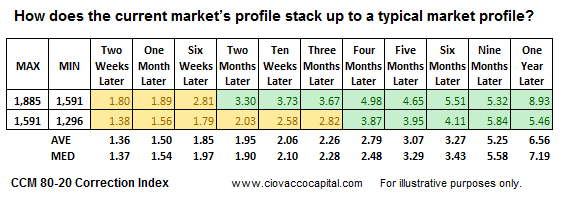
Shifting back to the longer-term outlook, two of our primary market models tell us, from a historical perspective, the risk-reward ratio for stocks over the next twelve months favors bullish outcomes over bearish outcomes by a margin of approximately eight to one. The CCM 80-20 Correction Index has been hovering between the two ranges identified by the arrows in the table below. 80-20 Correction Index values between 1,591 and 1,885 placed markets in a risk-reward ‘sweet spot’ in the period 1983-2010 (see green boxes between two months and twelve months).
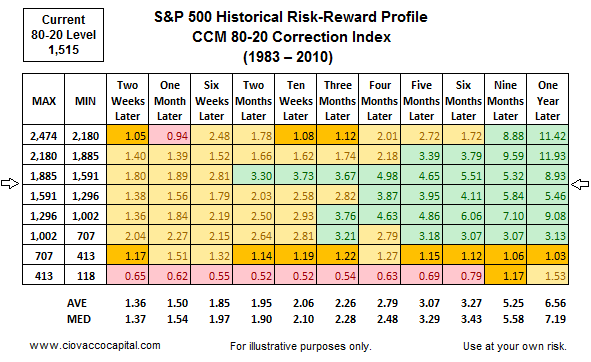
The table below compares the risk-reward ratios for the market’s current 80-20 Correction Index profile to both the average and median ratios. The higher the current ratios are relative to the average and median ratios, the more bullish the outlook.
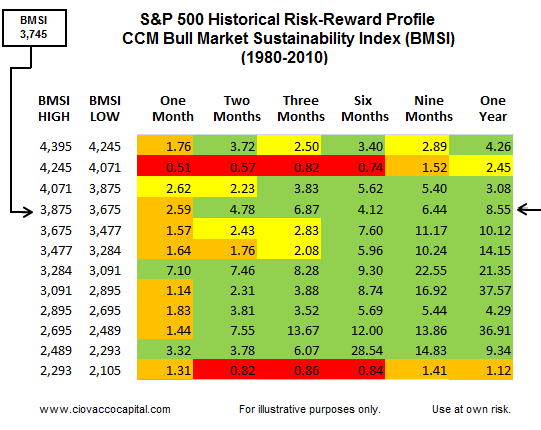
The CCM Bull Market Sustainability Index (BMSI) closed Tuesday at 3,745, which like the 80-20 Correction Index, yields a one-year historical risk-reward ratio of 8.55. The current ratio is favorable, but the BMSI is also approaching less favorable ranges.
By Chris Ciovacco
Ciovacco Capital Management
Copyright (C) 2011 Ciovacco Capital Management, LLC All Rights Reserved.
Chris Ciovacco is the Chief Investment Officer for Ciovacco Capital Management, LLC. More on the web at www.ciovaccocapital.com
Ciovacco Capital Management, LLC is an independent money management firm based in Atlanta, Georgia. As a registered investment advisor, CCM helps individual investors, large & small; achieve improved investment results via independent research and globally diversified investment portfolios. Since we are a fee-based firm, our only objective is to help you protect and grow your assets. Our long-term, theme-oriented, buy-and-hold approach allows for portfolio rebalancing from time to time to adjust to new opportunities or changing market conditions. When looking at money managers in Atlanta, take a hard look at CCM.
All material presented herein is believed to be reliable but we cannot attest to its accuracy. Investment recommendations may change and readers are urged to check with their investment counselors and tax advisors before making any investment decisions. Opinions expressed in these reports may change without prior notice. This memorandum is based on information available to the public. No representation is made that it is accurate or complete. This memorandum is not an offer to buy or sell or a solicitation of an offer to buy or sell the securities mentioned. The investments discussed or recommended in this report may be unsuitable for investors depending on their specific investment objectives and financial position. Past performance is not necessarily a guide to future performance. The price or value of the investments to which this report relates, either directly or indirectly, may fall or rise against the interest of investors. All prices and yields contained in this report are subject to change without notice. This information is based on hypothetical assumptions and is intended for illustrative purposes only. THERE ARE NO WARRANTIES, EXPRESSED OR IMPLIED, AS TO ACCURACY, COMPLETENESS, OR RESULTS OBTAINED FROM ANY INFORMATION CONTAINED IN THIS ARTICLE. PAST PERFORMANCE DOES NOT GUARANTEE FUTURE RESULTS.
Chris Ciovacco Archive |
© 2005-2022 http://www.MarketOracle.co.uk - The Market Oracle is a FREE Daily Financial Markets Analysis & Forecasting online publication.
Comments
|
grova
19 Jan 11, 17:27 |
International PE ratios
Hi .. does anyone know where I can see some historic charts of international indice P/E ratios |