


U.S. Dollar Index Down Trend Intact
Currencies / US Dollar Apr 13, 2011 - 12:20 PM GMTBy: Guy_Lerner

In my last look at the Dollar Index, I pointed out that the Dollar doesn't seem relevant anymore, and as long as the down trend was under control, then all seem to be ok. The trend is still down, and the technicals would suggest that we will be visiting the all time lows last seen in 2008 at some point in the near future. At that point, I surmise things will start to get interesting.
Figure 1 is a weekly chart of the Dollar Index (symbol: $DXY). The red colored price bars are positive divergence bars. In this case, I am looking at the divergence between a momentum oscillator, which is moving higher, and price, which is moving lower. Positive divergence bars tend to show up at market bottoms, but in and of themselves, they are not an absolute sign of a market bottom. Positive divergence bars signify slowing downside momentum, and from a technical perspective, the highs and lows of the positive divergence bar will serve as a trading range for future price movements. A close over the highs of the positive divergence bar will lead to a reversal of trend, and a close below the lows of the positive divergence often means accelerated selling as those traders expecting a reversal close their losing positions. So in a downtrend, a close below a positive divergence bar will lead to continuation of that down trend.
Figure 1. Dollar Index/ weekly
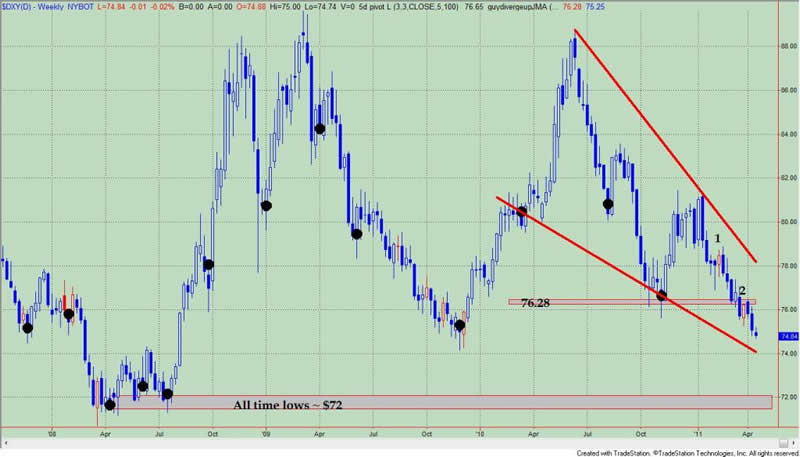
Returning to figure 1, we note the close below a positive divergence bar not only on February 25, 2011 (#1) but also on April 8, 2011 (#2). A close above the high (76.28) of the most recent positive divergence bar will reverse the downtrend. Until that happens, the trend remains down and in all likelihood, the Dollar Index will be visiting the all time lows last seen in 2008.
At that time, I am sure the markets will express grave concern as though no one saw this coming.
By Guy Lerner
http://thetechnicaltakedotcom.blogspot.com/
Guy M. Lerner, MD is the founder of ARL Advisers, LLC and managing partner of ARL Investment Partners, L.P. Dr. Lerner utilizes a research driven approach to determine those factors which lead to sustainable moves in the markets. He has developed many proprietary tools and trading models in his quest to outperform. Over the past four years, Lerner has shared his innovative approach with the readers of RealMoney.com and TheStreet.com as a featured columnist. He has been a regular guest on the Money Man Radio Show, DEX-TV, routinely published in the some of the most widely-read financial publications and has been a marquee speaker at financial seminars around the world.
© 2011 Copyright Guy Lerner - All Rights Reserved
Disclaimer: The above is a matter of opinion provided for general information purposes only and is not intended as investment advice. Information and analysis above are derived from sources and utilising methods believed to be reliable, but we cannot accept responsibility for any losses you may incur as a result of this analysis. Individuals should consult with their personal financial advisors.
Guy Lerner Archive |
© 2005-2022 http://www.MarketOracle.co.uk - The Market Oracle is a FREE Daily Financial Markets Analysis & Forecasting online publication.