


See Prechter's Stock Market "FREE FALL TERRITORY" Chart for Yourself
Stock-Markets / Stocks Bear Market Aug 19, 2011 - 06:35 AM GMTBy: EWI

 In the May 2008 issue of his monthly Elliott Wave Theorist, Robert Prechter showed this chart of the Dow Jones Industrials. As you can see, prices go back to the 1970s.
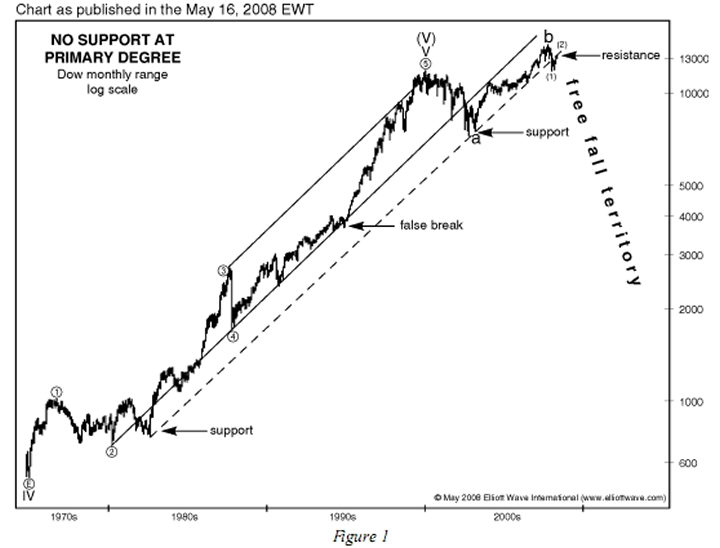
Please note that on the day this chart published (May 16), the Dow closed at 12,987 -- barely eight percent below the Dow's all-time high of the previous October.
Yet, as you can also clearly see, Prechter labeled the white space below the May 2008 price level as "Free Fall Territory."
At the time, no one else dared to publish such a bearish forecast. This was before the Lehman bankruptcy, the bailout binge, the home foreclosure crisis, and certainly before the worst of the stock market collapse.
In his June 2011 Theorist, Prechter published an update to the chart above, and here's the major difference: The updated chart "telescopes out" by one full degree of trend. Prices go back to the 1930s. The scale of the white space surrounding this chart's "free fall territory" label will show you what Prechter truly means.
His commentary in that issue also observed that
"the March-April [2011] rally was one of the most passionate bouts of stock buying I have ever witnessed."
Bob Prechter made this observation not in admiration, but as a warning.
In the past three weeks, the Dow Industrials have plummeted nearly 2,000 points. Most investors are confused and scared. How far down will the decline travel? Will it end tomorrow or go on for years?
The answers to these questions are crucial to your financial health. You can still get ahead of the trend, but only if you prepare now. Read EWI's long and near-term forecast. Get it in one comprehensive package -- and stay ahead of the crowd.
And -- get Bob Prechter's August Elliott Wave Theorist. It includes "many dozens" of charts. Bob will also record this Theorist as a rare "video issue" -- you'll be able to watch and listen as Prechter himself presents all the content.
Also -- as part of the same package, you get the August issue of our Elliott Wave Financial Forecast -- you'll see and read about the latest big picture in stocks, dollar, gold and more.
SAVE 57% with this LIMITED-TIME OFFER: See what we see next for the markets now via this instant-access discount subscription offer.
About the Publisher, Elliott Wave International Founded in 1979 by Robert R. Prechter Jr., Elliott Wave International (EWI) is the world's largest market forecasting firm. Its staff of full-time analysts provides 24-hour-a-day market analysis to institutional and private around the world.
© 2005-2022 http://www.MarketOracle.co.uk - The Market Oracle is a FREE Daily Financial Markets Analysis & Forecasting online publication.