


Beginning of Classic Stock Market Break Down
Stock-Markets / Stocks Bear Market Aug 23, 2011 - 06:32 AM GMTBy: Brian_Bloom

 Based on the chart below (courtesy Bigcharts.com) we have just witnessed the beginning of a classic breakdown.
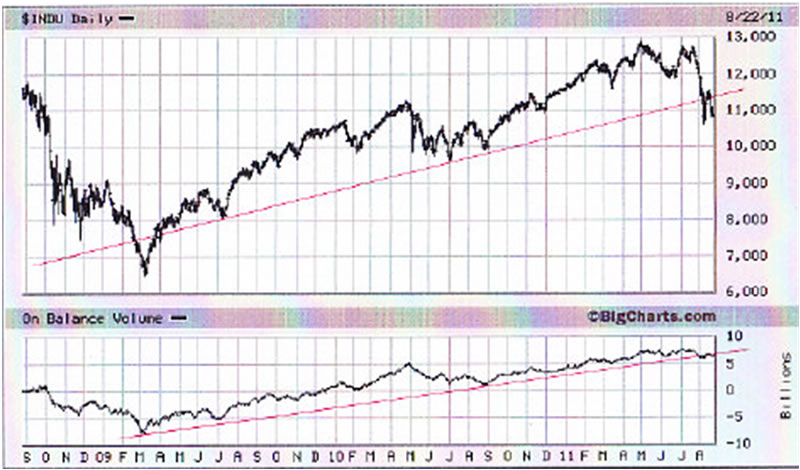
1. The index broke down through a rising trend line that was drawn by joining the maximum number of points of contact on a series of rising bottoms
2. A technical reaction brought the index back up to touch that trend line (It actually penetrated the trend line marginally)
3. The index fell again and encountered some support above the previous turning point – which might lead some into believing that the worst is over for the time being
4. The On Balance Volume Trend line was penetrated marginally on the down side – and then rose up to touch the trend line again
But what seems to stick out is the “falling tops” on the OBV chart that have manifested in the past few weeks. So let’s examine that:
The last time we had similar falling tops was in May and June 2010. At that time there was one more falling top – which allowed the chart to keep declining to “touch” the rising trend line without penetrating it on the downside. If we have another such falling top then the OBV chart will undoubtedly enter a bear trend as it pulls away from the rising trend line on the downside.
What is the probability that this will happen?
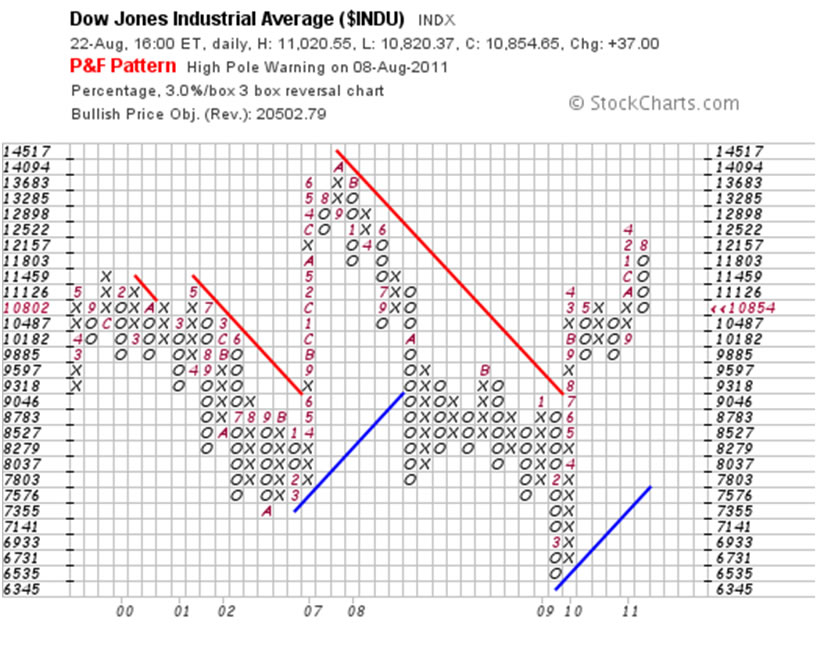
The chart below (courtesy stockcharts.com) shows that the “High Pole” reversal is still in progress and that the next level of support is in the region of 9885 – 10182. Typically, when a high pole reverses the chart retraces 90% - 100% of the height of the preceding pole (in this case, the pole of rising x’s). It follows that there “might” be another 600 to 1000 points on the downside before we see the market trying to stabilise.
Could it stabilise at its current level? Of course it could. Anything is possible. But what we need to concern ourselves with is a balance of probabilities. The balance of probabilities favours another 600 – 1000 points on the downside. (Time is not relevant in Point & Figure charting. It might take one day or one year to unfold).
Will that level hold? If not, then the next stop might be as low as 7,800 – a level that is validated by the less sensitive scale chart below:
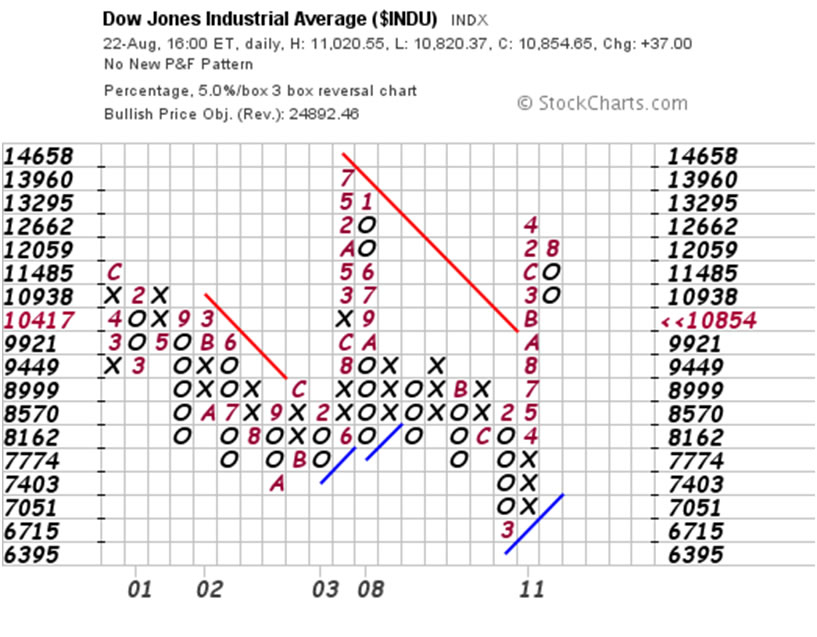
A concern I have – arising from the second chart above - is that the index will need to consolidate above 10182 to avoid giving a high pole reversal “sell” signal – which will indicate a downside potential of 7,774.
If we look at the 80 year chart of the Dow Jones Industrial Index below (courtesy Decisionpoint.com) we see some unusually bearish signs: (Author note: the trend lines were drawn by hand on a scanned chart – which accounts for the poor quality. However, we are taking a “high level” view here. The fine detail is not particularly relevant)
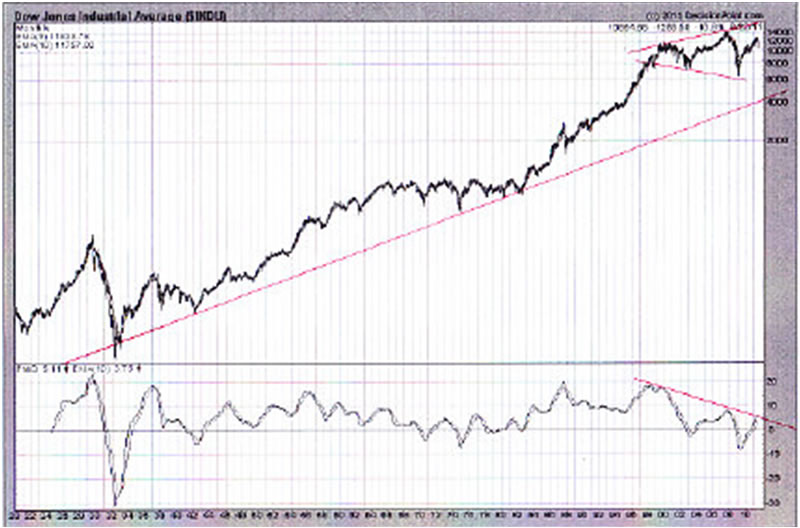
1. The index is very far above its trend line and, when that happens, the “tension” in the elastic rises to a level where the trend line is exerting a downward pull on the price that is too strong to overcome except in a period of hysterical optimism. There is a notable absence of hysterical optimism. The index is therefore unlikely to rise to new heights. There are two possibilities:
a. It might repeat the experience of the 1960s and 1970s and travel sideways for years
b. It might pull back savagely as we enter a classic “third” down leg in a five leg Primary Bear Market. Such a down leg is typically accompanied by panic selling
2. Whilst the index itself showed “rising tops” between 2000 and 2007, the oscillator at the bottom of the chart showed falling tops. This is known as a non-confirmation and in my earlier blogs over the months I have drawn attention to that non-confirmation
3. The two diverging trend lines on the top chart are known as a “bugle” or a “trumpet” formation. When a formation of rising tops and falling bottoms manifests it evidences a market that has become irrational and a market that is, as a consequence of this irrationality, “out of control”.
Sometimes, a bugle formation is followed by trend lines that converge again – which allows the formation of a diamond formation. If/when that breaks down it is usually an extremely serious breakdown.
Will the market head south from here?
In my view, that is not the really important question. More importantly, when one looks at all the above indicators as a package, there is a very low probability that the market will rise to new heights. If “the best” one can expect is a sideways movement for the next 10-15 years then it’s probably time to start changing one’s approach to investing. If the “bet” is on either a 20% to 50% fall or a sideways movement, why would anyone take such a bet?
Conclusion
If you are prepared to take the high (and rising) risk that your counterparty will not honour its side of a short sale bet that you might take, then you might want to think in terms of selling short. If you are not inclined to take such risks (which I am not) then you might think in terms of redirecting your equity investments to wealth creating activities that are run by solid management teams. Investing in what used to be known as “blue chips” is probably not a good idea.
Author Comment
In the late 1990s I began to sense that, by trying to manage the money supply, the US Federal Reserve was facilitating the emergence of a “mania” in the markets.
Yes, the markets might travel sideways from this point for the next 10-15 years. Yes, a Diamond formation might or might not manifest as the years pass – but what will differentiate this diamond (if it does manifest) from all other diamonds this analyst has ever seen will be the time scale. It will have taken something like 20 years to form.
In my view, whether the market breaks down from here or whether it consolidates at its current level and then falls apart after breaking down from a diamond formation within the next decade, is an irrelevancy. Far more important is the implication that we are probably witnessing what might be described as the end of an era – probably the culmination of a thought paradigm that gave rise to the Industrial Revolution.
This is not necessarily a bad thing. This thought process has given rise to a mindset of “more is better”. So we have had a tripling of human population since World War II and a rise in Carbon Dioxide levels which have not only had an impact on our climate, but also on the acidity levels of our oceans. The oceans have been warming and dissolved oxygen levels might now be reducing as a consequence of melting methane clathrates. Oxygen breathing life in the oceans is being increasingly threatened. We are consuming our raw materials at a profligate rate and are witnessing a decline in energy production per capita across the planet. And how will we cope if the global warming we have been experiencing is really the culmination of an interglacial warming period? How will we cope if an Ice Age emerges? Common sense dictates that, if we carry on in this vein, humanity will force its own demise.
So what can be done about this? What is the appropriate response? Clearly, the response cannot be described in a sound bite. We are contemplating what we hope will emerge to become a thought paradigm that will be ensure the survival of the human species. This is not the stuff of parlour games.
It was when I finally came to understand the implications of the last two sentences – in around 2002 – that I began to apply my mind to the question of “What can be done about this?”
“Some” possible answers (which will hopefully serve as a point of departure to further discussion but within the context of a shifting thought paradigm) are suggested in my two factional novels, Beyond Neanderthal and The Last Finesse. The former was published in 2008 and the latter is being prepared for publication. If you are interested in acquiring a copy, please email me a info@beyondneanderthal.com and I will contact you when it is available. The reason I chose to communicate by way of a novel is that the contents are packaged in an easy-to-read format and contain information that some may consider to be “outside the box”. Well, look at this way: It was “inside the box” thinking that got us into this mess in the first place.
By Brian Bloom
Once in a while a book comes along that ‘nails’ the issues of our times. Brian Bloom has demonstrated an uncanny ability to predict world events, sometimes even before they are on the media radar. First he predicted the world financial crisis and its timing, then the increasing controversies regarding the causes of climate change. Next will be a dawning understanding that humanity must embrace radically new thought paradigms with regard to energy, or face extinction.
Via the medium of its lighthearted and entertaining storyline, Beyond Neanderthal highlights the common links between Christianity, Judaism, Islam, Hinduism and Taoism and draws attention to an alternative energy source known to the Ancients. How was this common knowledge lost? Have ego and testosterone befuddled our thought processes? The Muslim population is now approaching 1.6 billion across the planet. The clash of civilizations between Judeo-Christians and Muslims is heightening. Is there a peaceful way to diffuse this situation or will ego and testosterone get in the way of that too? Beyond Neanderthal makes the case for a possible way forward on both the energy and the clash of civilizations fronts.
Copies of Beyond Neanderthal may be ordered via www.beyondneanderthal.com or from Amazon
Copyright © 2011 Brian Bloom - All Rights Reserved
Disclaimer: The above is a matter of opinion provided for general information purposes only and is not intended as investment advice. Information and analysis above are derived from sources and utilising methods believed to be reliable, but we cannot accept responsibility for any losses you may incur as a result of this analysis. Individuals should consult with their personal financial advisors.
Brian Bloom Archive |
© 2005-2022 http://www.MarketOracle.co.uk - The Market Oracle is a FREE Daily Financial Markets Analysis & Forecasting online publication.