


Stocks Bear Market Focus Point: The Nasdaq 100 Leaders’ Indices - Weighted Interpretations
Stock-Markets / Stocks Bear Market Nov 23, 2011 - 09:50 AM GMTBy: Garry_Abeshouse

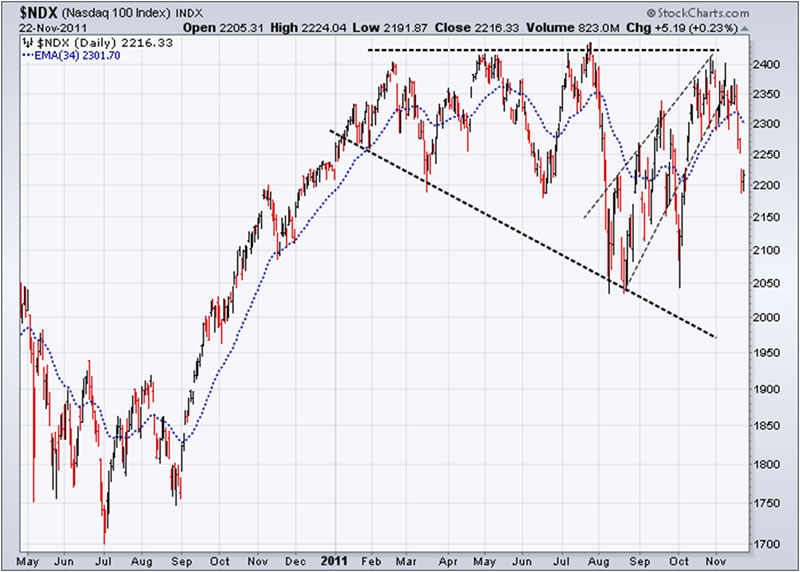
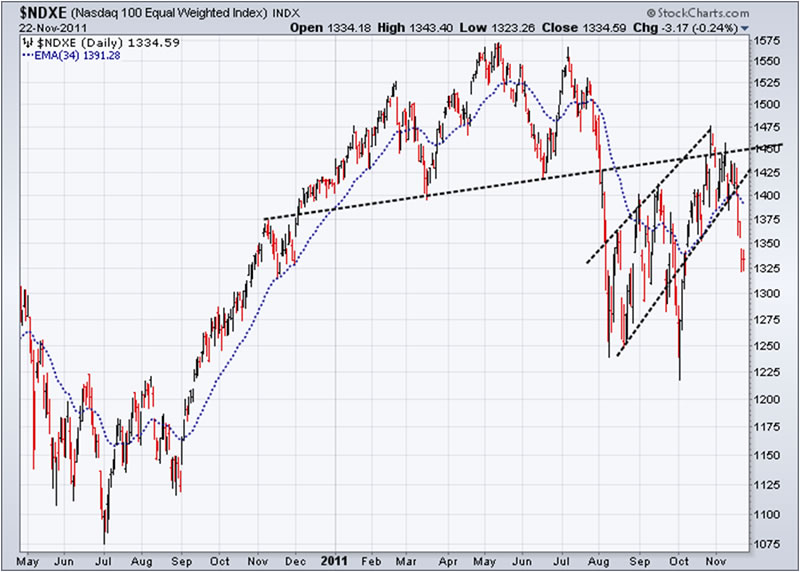
 Below is just one example of what very basic careful comparative analysis, completely devoid of elaborate indicators and envelopes can tell you. The two charts below are just simple daily charts of the Nasdaq 100 Index. The $NDXE is equal weighted and the $NDX is a modified capitalization-weighted index. What is unique about the Nasdaq 100 Index is that as well as being a leaders’ index of 100 of the largest companies listed on US exchanges, they are also the only US composite indices that contain no finance stocks at all. None.
Industry weightings of the Nasdaq 100 indices, $NDX and $NDXE, as at November 2011 are:
54.3% - Technology, 10.4%; Healthcare, 24.3%; Industrial, 10.2%; Telecommunications; 0.8%; Transportation; 0.0% - Finance
The emphasis on Technology stocks is important as this is where most of the more extreme bullish action has been over the last three years. The huge upward moves in stocks such as Apple and Baidu are examples of flagship stocks that have stolen the hearts, minds and credit cards of a generation of Generation Y consumers, both in the West and in China, whose money has been the backbone of their success. The lack of finance stocks in the Nasdaq 100 is also important as the unique features pertinent to the ongoing financial crisis in this sector, tend to muddy the waters of interpretation at critical times in other composite indices that contain finance stocks. Personally the more homogeneous the constituents of an index are, the more I like it – and if the index is equal weighted, so much the better, as it will more likely be a more accurate representation of market movements in that business sector as a whole.
The differentiation between these two versions of the same Index as shown below as daily charts have never been so starkly defined. The $NDX chart has a 12 month long broadening top ending in an upward wedge while the $NDXE has a very different shaped Head & Shoulders top. These very different tops clearly illustrate the point I am trying to make. As you can see, not only is the top of the equal weighted chart better defined, but the break below the neckline, the pullback and subsequent bearish break over the last few days gave a better indication of underlying market weakness.
As volatility increases across the world’s financial sector take their toll over the coming months, I expect these two indices will prove their worth as essential indicators of market action.
The Bear Market is a learning experience second to none.
It is my view that the reluctance to believe you are in a prolonged bear market slowly decreases over time until the final bottom is reached and closure is realised. During this process, I expect volume levels to be maintained and even increase, as the continuity of strongly held bullish beliefs, reinforced by oversold MACDs and an ever optimistic media continue to provide hope that the absolute bottom will always be just below current prices. It is in this chaotic confusion of misplaced beliefs and misinterpretation of events that we find ourselves in now.
For most of the time during a major Bear Market, it may feel like experiencing death from a thousand cuts. One short term bearish pattern is linked to another through subsequent continuation patterns and multiple small moves down and just as you are lulled into a false sense of security, a panic ensues and there is another steep fall in prices. Then, at the bottom of the fall, bearish sentiment suddenly morphs into a short steep rally and the process starts all over again.
During this long unwinding of earlier era excesses, there are always some who would still like to hang on to past glories by looking for bargains at each fall in prices. These optimistic traders keep volumes relatively high all the way down to the bottom, when at the last sigh of the Bear, volume for a brief time finally falls away, as burned traders and distraught investors shy away from the stock market as they would the plague. This is why negative sentiment is always at its peak at market bottoms.
But it is not for me to speculate at this early stage as to where this final bottom lies and when it will happen and – what the price of gold will be when this miraculous event happens. I leave these speculations to others more knowledgeable than I. All I know is that there still is a long way down to go.
Till next time.
Garry Abeshouse
Technical Analyst.
Sydney
Australia
I have been practicing Technical Analysis since 1969, learning the hard way during the Australian Mining Boom. I was Head Chartist with Bain & Co, (now Deutsch Bank)in the mid 1970's and am now working freelance. I am currently writing a series of articles for the international "Your Trading Edge" magazine entitled "Market Cycles and Technical Analysis".
I have always specialised in medium to long term market strategies and after discovering the excellent Point & Figure Charts from Stockcharts.com in mid 2008, have concentrated on this style of charting ever since.
© Copyright Garry Abeshouse 2011
Disclaimer: The above is a matter of opinion provided for general information purposes only and is not intended as investment advice. Information and analysis above are derived from sources and utilising methods believed to be reliable, but we cannot accept responsibility for any losses you may incur as a result of this analysis. Individuals should consult with their personal financial advisors.
© 2005-2022 http://www.MarketOracle.co.uk - The Market Oracle is a FREE Daily Financial Markets Analysis & Forecasting online publication.