


Shale Oil is a Big Game Changer for Dow-to-Gold Ratio
Commodities / Commodities Trading Apr 17, 2013 - 07:42 AM GMTBy: Gary_Dorsch

 Financial history is marked with times when populations took collective leave of their senses and succumbed to delusions of ever-expanding wealth. Times of rampant speculation have been enthralled by the introduction of new technologies, that are used to justify pumping-up market valuations, - not just for the present, but also for the near future, and far over the horizon as well. Quite often, the new found wealth is nothing more than a mirage. The wild enthusiasm for the stock market is often overtaken by speculative froth and emotional mania. As such, spectacular rallies deliver massive gains for one generation of lucky investors, but also create massive overvaluations that plague the next generation.
In the case of central banks, - they usually ignore stock market bubbles that expand as a result of liquidity conditions that have been "too easy for too long." In today's markets, central bankers in England, Japan, and the US have jettisoned the principles of free markets, and instead, are working overtime at the behest of the ruling politicians, to artificially inflate the value of their local equity markets, - deploying unorthodox tools such as massive liquidity injections and locking borrowing costs near zero-percent. "The tools we have involve affecting financial asset prices, to the extent that consumers feel wealthier, they'll feel more disposed to spend," Fed chief Ben Bernanke explained.
Never mind that 82% of US-listed equities are owned by just 10% of the US-population. The Fed's theory of "trickle down" economics, - that is to say, inflating the money supply in order to inflate the stock market, will somehow enrich the lives of greater society, - is nothing more than a pipedream at best, or rather an act of purposeful deceit at its worst. "By this means government may secretly and unobserved, confiscate the wealth of the people and not one man in a million will detect the theft. And while the process impoverishes many, it actually enriches some," observed John Maynard Keynes, in 1920. In other words, the US-central bank's policy is strictly designed to enrich the fortunes of the Ultra-wealthy.
Last week, the Dow Jones Industrials soared to as high as 14,850, its highest level in history. The Dow's four year advance "has prompted plenty of catcalls and profound skepticism about whether equities have gone too far, too fast in what is the least-loved Bull market in history." Moreover, the rally highlights the vast disconnect between the bleak economic and social conditions facing working people and the staggering rise in corporate profits, inflated stock and bond prices, and the rapidly rising wealth of the corporate - financial elite in the US and around the world. Even as national and international bodies have issued one dismal report on the global economy after another, the US-bankers and CEO's have celebrated ever-rising stock values. The rise in corporate profits is chiefly the result of an unrelenting drive to lower workers' wages and benefits, while ratcheting up workers' output.
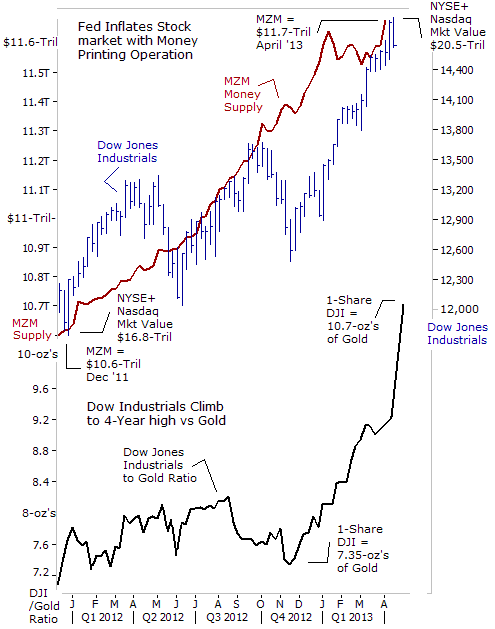
Nowadays, there is widespread understanding that the Fed's ultra easy money policies (dubbed QE) have gotten a lot of bang for the buck. By increasing the quantity of the high-octane MZM money supply in circulation, by $1.1-trillion since the start of 2012, the Fed was able to engineer a powerful rally, - increasing the market value of the shares listed on the NYSE and Nasdaq by $3.7-trillion. Today, the value of the US-stock market stands at a record $20.5-trillion in April, and it would require a steady stream of QE-injections into the future to support today's lofty valuations, and to lift the stock market into higher ground.
Yet at the same time, Gold Bugs are licking their wounds, and asking why the vast money printing operations of the bank of Japan and the Fed aren't have the same beneficial effect on the price of Gold or Silver. Instead, to the extreme contrary, - the price of Gold suddenly collapsed in recent days, suffering its worst rout in 30-years. The "Black April" Crash of the Gold market comes on the heels of a 19-month roller coaster ride, in which the price of the yellow metal swung widely, but eventually landed at the border-line of Bear market territory at $1,560 /oz. However, once this key horizontal line of support was penetrated - huge sell orders kicked-in. The Gold market was suddenly thrust into a panicked free-fall, spiraling -13% lower until finding support at $1,320 /oz, where bargain hunters emerged.
Still, there were advance warning signs of trouble for the Gold market. Since mid-November, the market value of the Dow Jones Industrials - compared to the price of Gold (the Dow-to-Gold ratio), was moving steadily higher. Traders figure the best way to profit from the Fed's QE-schemes, is through purchasing US-stock market index futures and ETF's. Today, 1-share of the Dow Jones Industrials can fetch 10.7-ounces of Gold, compared with only 7.35-ounes last November. Given that the Dow peaked at 42-oz's of Gold in 1999, there's still plenty of room for the Dow to regain lost ground against the yellow metal.
When speaking of the Dow-to-Gold Ratio, - no matter which way the wind blows on Wall Street, the Dow is likely to gain further ground compared to the price of Gold. One big advantage that the US-stock market has over the precious metals is the widespread perception that the Fed will always ride to the rescue of Wall Street whenever risky bets go sour - dubbed the "Bernanke Put." Yet there's another underlying dynamic at work that might explain why the Dow is soaring while at the same time, the price of Gold is unable to sustain a sizeable rally and worse yet, - sliding sharply lower. There is a new technology at work in the global economy that might explain these diverging trends.
In the view of the Global Money Trends newsletter, the "Shale Oil" Revolution, - still in it's infancy, might be the catalyst that's fueling the Dow's spectacular gains versus the price of Gold, and more than just another mirage. Two new innovative technologies - called horizontal drilling and "Fracking" - can provide the US-economy with an abundant source of relatively cheap energy for decades to come. As such, the Shale Oil Revolution has the potential to hold down the US-inflation rate, and at the same time, enable the Fed to continue printing money for longer periods of time, thus inflating equity prices.
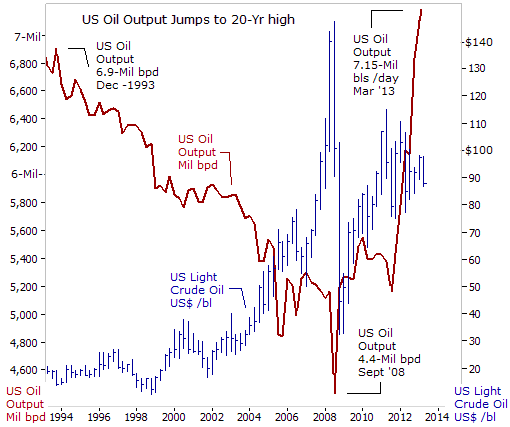
US-oil output has already risen for four straight years, and last year was the biggest single-year gain since 1951. The boom has surprised even the experts.The Energy Department forecasts that US-production of crude and other liquid hydrocarbons, which includes bio-fuels, will average 11.4-million barrels per day (bpd) this year. That would be a record for the US and just below Saudi Arabia's output of 11.6 million barrels. Citibank forecasts US-production could reach 13-million to 15-million bpd by 2020, helping to make North America "the new Middle East." Increased drilling is fueling an economic boom in states such as North Dakota, Oklahoma, Wyoming, Montana and Texas, all of which have unemployment rates far below the national average of 7.6-percent.
The major factor driving domestic production higher is a newfound ability to squeeze oil out of rock once thought too difficult and expensive to tap. Drillers have learned to drill horizontally into long, thin seams of shale and other rock that holds oil, instead of searching for rare underground pools of hydrocarbons that have accumulated over millions of years. To free the oil and gas from the rock, drillers crack it open by pumping water, sand and chemicals into the ground at high pressure, a process is known as hydraulic fracturing, or "fracking," that has unlocked enormous reserves of shale oil and natural gas.
Production from US-shale formations is expected to grow from 1.6-million bpd this year to 4.2-million bpd by 2020, according to Wood Mackenzie.That means these new formations will yield more oil by 2020 than major oil suppliers such as Iran and Canada produce today.Given that US-oil output had been in decline for more than two decades, this is a remarkable turn of events. And in another stunning turnaround, by the end of this year, US-crude oil imports will be lower than at any time since 1992, at 41% of consumption.The US imported nearly 60% of the oil it burned in 2006, meaning the US could soon become a net exporter of energy.
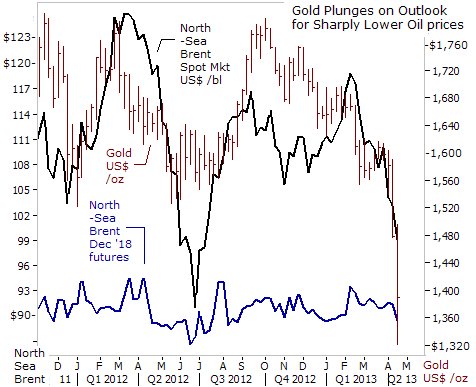
Should the potential of "fracking" materialize, it could have the most significant long-term impact on oil prices of any supply event in recent decades. Until recently, the growth in US-shale oil output wasn't sufficient to meaningfully weaken global oil prices. However, it's had a notable impact on long-term price expectations. For instance, thefutures price of North Sea Brent, for delivery in December 2018, has been holding fairly stable at around $92/barrel (bbl) for much of the past year, and closed at $90.16 /barrel on April 16th. That's about $10 /barrel below the current spot market price at $100 /barrel.
This inverted price curve signals that traders expect a gradual erosion of oil prices over the next five years, regardless of the amount of paper money that central bankers are printing under their QE-schemes. The inverted price curve also differs considerably from most of the prior decade when the back end of the oil market closely followed spot prices higher. In 2008, in particular, the five-year forward price of oil rallied to $140 per barrel as the front hit $140, because no new supply source was evident to anchor expectations.
Since the first week of February however, the price of Brent crude oil has been tumbling from as high as $119 per barrel to as low as $98 /barrel on April 15th. Likewise, the slide in crude oil prices chipped away at the underpinnings of the Gold market. The apparent trigger for Gold's stunning collapse of roughly $230 /oz to $1,330 /oz was a warning by Goldman Sachs, which predicted on April 10th that Gold would tumble towards $1,350 /oz sometime in 2014. But in today's world of lightning fast computerized trading, what GS expected to happen over the next 12-months, was instead condensed into just a few days. Combined with sharp declines for the prices of base metals, gasoline and agricultural commodities, such as corn and sugar, the baseline of support for the Gold market became un-hinged.
Even central banks were caught wrong footed by Gold's downward spiral. Last year, central banks were net buyers of 532-tons of Gold - their largest investment since the mid-1960's. Before the 2008 financial crisis, central banks were net sellers of 400-to-500-tons a year.InDecember, Russia added 20-tons to raise its gold reserves to 958-tons, propelling the country up two places to sixth in the world gold holding rankings. Over the last decade Russia's central bank acquired 570-tons of Gold, and now makes-up 10% of the Kremlin's foreign currency reserves. Turkey raised its hoard by 46-tons to 360-tons. In November, Korea upped its gold holdings by 14-tons to 84-tons.Still,traders watch the economies ofChina and India - the top consumers of Gold, generating 55% of global jewelry demand and 49% of global demand,
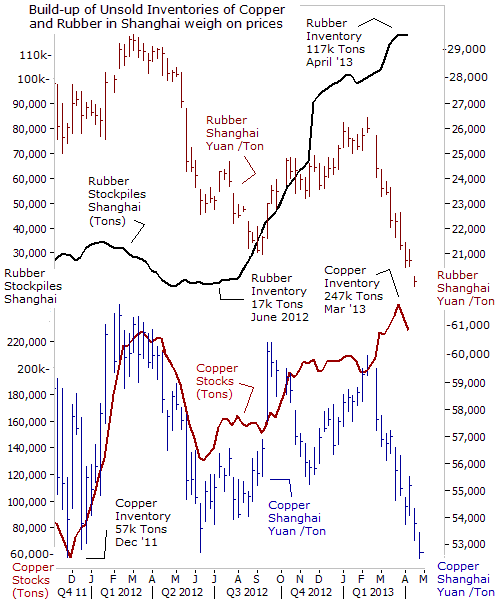
News that China's economy grew by +7.7% in the first quarter, far less than its double-digit pace in the past three decades, pummeled commodity markets, especially industrial raw materials, such as aluminum, crude oil, copper, and rubber. China is the world's top consumer of nearly all major commodities in its race to build factories, offices and roads, voraciously consuming everything from copper to coal. Thus, a slowdown in Chinese economic growth, together with the deepening recession in the Euro-zone, led to a huge build-up of unsold supplies of commodities in Shanghai warehouses, including those for copper, and rubber.
Traders have deep doubts about the credibility of China's economic statistics. Part of the reliability problem is Beijing's near-total control over economic numbers, in some cases meaning an outright ban on all others collecting competing data. China's economic data is now coming under even greater scrutiny, since China's growing clout in the global economy, means that its reporting of key data can roil global commodity and equity markets.
Still, traders can observe the price of key industrial commodities trading at the Shanghai Futures Exchange, and the size of unsold inventories, to draw more reliable appraisals of the health of the Chinese factory sector. On April 15th, the price of natural rubber, dropped by more than -5%, skidding to 19,520-yuan per ton, coming under pressure from a -10% slump in Tokyo rubber prices to ¥249 /kg. Inventories of rubber in top importers China and Japan are at multi-year highs and demand from the automobile sector, the major rubber-consuming industry, is slumping. This suggests that Chinese and Japanese rubber users may choose to use up existing inventories in coming months rather than continue importing.
The sharp slide in rubber prices is all the more remarkable, considering that Thailand, the world's biggest producer and exporter of natural rubber, together with Malaysia and Indonesia agreed last year to cut exports by 300,000-tons between October and March. The three nations account for 70% of the world's exports of natural rubber. Aluminum prices fell to their lowest level in 3-½-years, tracking falls across base metals tumbling to $1,818 /ton.
If commodities prices continue to drop much below current levels, some high-cost producers would start losing money, forcing them to shut down production. Moreover, base metal miners and shale oil producers could respond to the drop in prices by curtailing their expansion projects. For example, analysts estimate that the highest cost Canadian heavy-oil producers need US Light crude to be trading at least at US$85 a barrel to cover their costs, triggering talk in the market of imminent output cuts. In due course, lower capital outlays would translate into less supply growth, and eventually lift prices higher.
Until then, the Fed and other G-7 central banks are sitting in the drivers' seat, enjoying the renewed slide in commodity prices and subdued inflation pressures. Meanwhile, the meltdown in the Gold market, -21% year-to-date (y-t-d) has sent shockwaves through the commodity markets. So far this year alone, Silver is -28% lower, Platinum is -10% lower, Copper fell to its lowest level in 1-½ years, and is -11% lower, while aluminum hit a 3-½-year low. Unleaded gasoline plunged 45-cents /gallon from a month ago to $2.76 /gallon today. Wheat is -11% lower, and sugar is -8.8% lower, and Arabica coffee fell to $1.34 /lb, a three-year low.
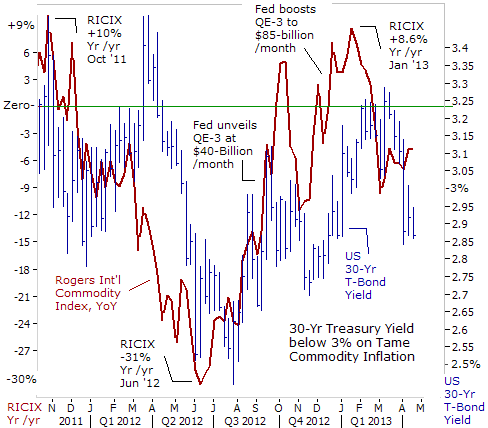
Weighed down by an across the board sell-off, the Rogers Int'l Commodity Index (RICIX), is -5.6% lower today, compared with a year ago. The RICIX remains mired in negative territory, despite the doubled barreled money printing binges by the Bank of Japan and the Fed, that's expected to pump as much as $2-trillion of freshly printed paper currency into the world markets in the year ahead. Instead, the deepening economic recession in the Euro-zone, the world's largest trading bloc, and stalling economies in Canada and Russia is trumping the effects of QE, and weakening the demand for industrial commodities.
Although a majority of analysts profess to be wary of a dangerous bubble that's brewing in the in G-7 bond markets, - the Fed has successfully enforced its policy of "Financial Repression," with purchases of $45-billion per month of US T-notes. Offered at a yield at 2.88% today, the Treasury's 30-year bond is yielding -25-basis points less than a year ago. The Fed is simply following the blueprints of the Bank of Japan. Although the US T-bond market is a ticking time bomb that could explode at anytime, for now, the Fed is doing a masterful job of rigging the T-bond market at ultra-low yields, a job that is made a lot easier because of "fracking." In turn, America's transformation into an energy exporter is expected to enable the Dow Jones Industrials and the Transportation index to significantly outperform the Gold market, - no matter which way the winds blow, - in the years ahead.
This article is just the Tip of the Iceberg of what’s available in the Global Money Trends newsletter. Subscribe to the Global Money Trends newsletter, for insightful analysis and predictions of (1) top stock markets around the world, (2) Commodities such as crude oil, copper, gold, silver, and grains, (3) Foreign currencies (4) Libor interest rates and global bond markets (5) Central banker "Jawboning" and Intervention techniques that move markets.
By Gary Dorsch,
Editor, Global Money Trends newsletter
http://www.sirchartsalot.com
GMT filters important news and information into (1) bullet-point, easy to understand analysis, (2) featuring "Inter-Market Technical Analysis" that visually displays the dynamic inter-relationships between foreign currencies, commodities, interest rates and the stock markets from a dozen key countries around the world. Also included are (3) charts of key economic statistics of foreign countries that move markets.
Subscribers can also listen to bi-weekly Audio Broadcasts, with the latest news on global markets, and view our updated model portfolio 2008. To order a subscription to Global Money Trends, click on the hyperlink below, http://www.sirchartsalot.com/newsletters.php or call toll free to order, Sunday thru Thursday, 8 am to 9 pm EST, and on Friday 8 am to 5 pm, at 866-553-1007. Outside the call 561-367-1007.
Mr Dorsch worked on the trading floor of the Chicago Mercantile Exchange for nine years as the chief Financial Futures Analyst for three clearing firms, Oppenheimer Rouse Futures Inc, GH Miller and Company, and a commodity fund at the LNS Financial Group.
As a transactional broker for Charles Schwab's Global Investment Services department, Mr Dorsch handled thousands of customer trades in 45 stock exchanges around the world, including Australia, Canada, Japan, Hong Kong, the Euro zone, London, Toronto, South Africa, Mexico, and New Zealand, and Canadian oil trusts, ADR's and Exchange Traded Funds.
He wrote a weekly newsletter from 2000 thru September 2005 called, "Foreign Currency Trends" for Charles Schwab's Global Investment department, featuring inter-market technical analysis, to understand the dynamic inter-relationships between the foreign exchange, global bond and stock markets, and key industrial commodities.
Copyright © 2005-2013 SirChartsAlot, Inc. All rights reserved.
Disclaimer: SirChartsAlot.com's analysis and insights are based upon data gathered by it from various sources believed to be reliable, complete and accurate. However, no guarantee is made by SirChartsAlot.com as to the reliability, completeness and accuracy of the data so analyzed. SirChartsAlot.com is in the business of gathering information, analyzing it and disseminating the analysis for informational and educational purposes only. SirChartsAlot.com attempts to analyze trends, not make recommendations. All statements and expressions are the opinion of SirChartsAlot.com and are not meant to be investment advice or solicitation or recommendation to establish market positions. Our opinions are subject to change without notice. SirChartsAlot.com strongly advises readers to conduct thorough research relevant to decisions and verify facts from various independent sources.
Gary Dorsch Archive |
© 2005-2022 http://www.MarketOracle.co.uk - The Market Oracle is a FREE Daily Financial Markets Analysis & Forecasting online publication.