


U.S. Long Bond, an Historic Trading Opportunity?
Interest-Rates / US Bonds May 04, 2015 - 10:29 AM GMTBy: Dan_Norcini

 This past week saw a huge swing in interest rates at the long end of the curve with the long bond in particular getting knocked for a loop.
June Bonds Daily Chart

As you can see from the chart, prices plunged lower Tuesday-Friday with support being broken on Tuesday. The market had an intraday recovery that day but the next day, it commenced plunging again, this time being unable to recapture broken chart support which "reversed polarity" and served to cap the contract on the upside.
On Thursday, once the unemployment numbers were released, the bonds broke yet another layer of support again recovering that level by the end of the trading session. Friday however witnessed yet another plunge this time crashing back through support just like what happened on Wednesday.
The question now becomes, Will the broken support level near 158^20 serve as overhead resistance and hold any upside retracement efforts? The answer to that is unclear at this time but time will tell.
June Bonds Daily Chart
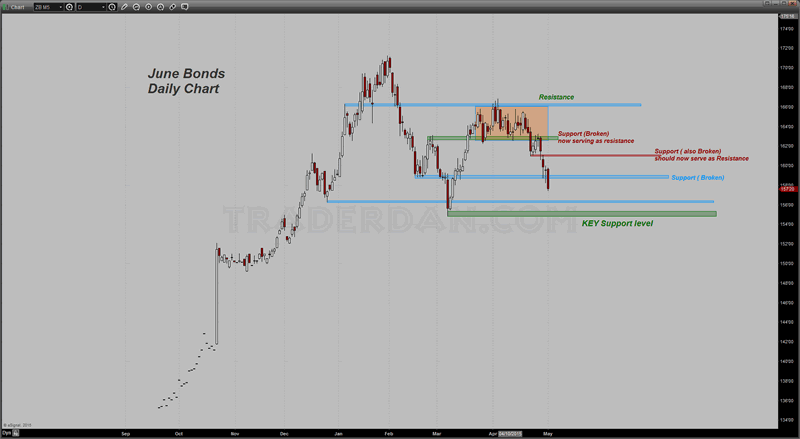
What is noteworthy however is that this contract is giving every indication of a long term permanent top being made in the bonds and thus a long term low in interest rates. For me, the KEY to the bond market will be whether or not this contract will eventually break that MAJOR SUPPORT LEVEL down near 155. If it does, that is it for interest rates. They are going up. If not, it will bounce and move back into a range trade with interest rates remaining at low levels albeit with a higher bias.
In other words, a break in that Key support level means long term interest rates will move steadily higher. If support holds, long term interest rates will SLOWLY GRIND HIGHER. It becomes merely a matter of the RATE AT WHICH RATES will rise.
Of course, since none of us are omniscient except for God Most High, we always have to allow for the possibility that some sort of series of events could work to push the bonds back up again but I suspect they would have great difficulty clearing the bottom of the congestion zone that contained prices in the late March through April time frame.
In going over the Commitment of Traders report for this particular contract, it is revealing to see who the BIG LONGS are in this market.
Long Bond Committment of Traders Chart 1
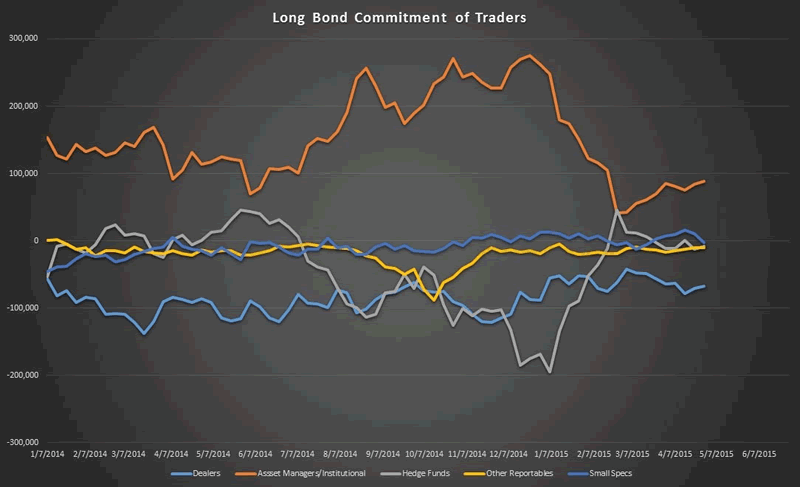
I only went back to the beginning of 2014 so as not to clutter the chart too much but as you can see, the ASSET MANAGERS/INSTITUTION class of traders were and remain, the big longs in this market. Surprisingly enough, at least to me, is the positioning of the HEDGE FUNDS. They were the big shorts in the market at the start of this year.
Look at the chart and see the results of this positioning.
June Bonds Daily Chart

Asset managers and institutions piled into the long bond with hedge funds taking the other side of the trade as we moved through Q4 2014. Bonds then topped out in late January/early February of this year as the market received back to back strong payrolls reports and revisions to previous month data. Hedge funds raked in some huge profits from those short trades of theirs in the process with asset managers taking a big hit.
Subsequent economic data came in weaker than expected and that caused bonds to reverse course with asset managers reloading on longs once more as hedge funds again took the other side and shorted the market.
Long Bond Committment of Traders Chart 2

This week's COT report does not reflect the breakdown on the charts that commenced in earnest on Wednesday and continued through Friday but based on the previous price action and corresponding shift among traders' positioning, one can assume with great confidence that Asset managers were liquidating long positions late this past week with hedge funds booking profits on their short positions.
It does appear that we have a pattern that has formed in the bond with hedgies willing the play the long bond from the short side. If that is the case, and it appears that it is, rallies in the bonds are going to be sold. I am especially anxious to see this coming Friday's payrolls report because if it is a strong number (and I do not know what we are going to get), we could see more long side liquidation from the Asset manager class as they are the only group of traders that are currently net longs in this market. All four of the remaining classes of traders, including the Dealers, are net short this market.
Generally speaking, in a rising interest rate environment, bonds are usually not in favor as to Go-To asset class since fixed income investments tend to fall out of favor if investors believe incipient inflation pressures are potentially on the rise. This is the reason I have been remarking that something is taking place in the interest rate market that dictates we should pay very close attention.
The market will be well ahead of the Fed when it comes to anticipating any pick up in inflation. As I have noted, the rising TIPS spread is an indication that expectations are slowly changing.
My reason for such close attention to this market is because we have been dealing with HISTORIC lows in interest rates and thus HISTORIC highs in the bond market. If, we have seen an indication that this is coming to an end, the SHORT BOND trade will be an historic trading opportunity since being able to ride a market down that has relentlessly risen for more years than many of us have even been trading, will be a once in a lifetime trade.
Of course, I have been thinking that same thing now especially after the Fed first announced their TAPERING of the final QE round. You can look at the chart and see how well that worked out for me! It didn't!
Stay tuned on this one...
Dan Norcini
Dan Norcini is a professional off-the-floor commodities trader bringing more than 25 years experience in the markets to provide a trader's insight and commentary on the day's price action. His editorial contributions and supporting technical analysis charts cover a broad range of tradable entities including the precious metals and foreign exchange markets as well as the broader commodity world including the grain and livestock markets. He is a frequent contributor to both Reuters and Dow Jones as a market analyst for the livestock sector and can be on occasion be found as a source in the Wall Street Journal's commodities section. Trader Dan has also been a regular contributor in the past at Jim Sinclair's JS Mineset and King News World as well as may other Precious Metals oriented websites.
Copyright © 2015 Dan Norcini - All Rights Reserved
All ideas, opinions, and/or forecasts, expressed or implied herein, are for informational purposes only and should not be construed as a recommendation to invest, trade, and/or speculate in the markets. Any investments, trades, and/or speculations made in light of the ideas, opinions, and/or forecasts, expressed or implied herein, are committed at your own risk, financial or otherwise. The information on this site has been prepared without regard to any particular investor’s investment objectives, financial situation, and needs. Accordingly, investors should not act on any information on this site without obtaining specific advice from their financial advisor. Past performance is no guarantee of future results.
Dan Norcini Archive |
© 2005-2022 http://www.MarketOracle.co.uk - The Market Oracle is a FREE Daily Financial Markets Analysis & Forecasting online publication.