


Dry Bulk Shipping Index Chart Analysis Update 2015
Commodities / Commodities Trading May 15, 2015 - 11:19 AM GMTBy: Tony_Caldaro

 In 2012 we thought we had identified a 13 year cycle in the shipping industry. Then in mid-2012 we published this report detailing the cycle and anticipating a rally in rates: https://caldaro.wordpress.com/2012/09/27/dry-bulk-shipping-industry/. The rally in rates did occur as the BDI more than tripled by late-2013. As a follow up to that we report we published an update in late-2013, which we got all wrong: https://caldaro.wordpress.com/2013/12/08/dry-bulk-shipping-update/.
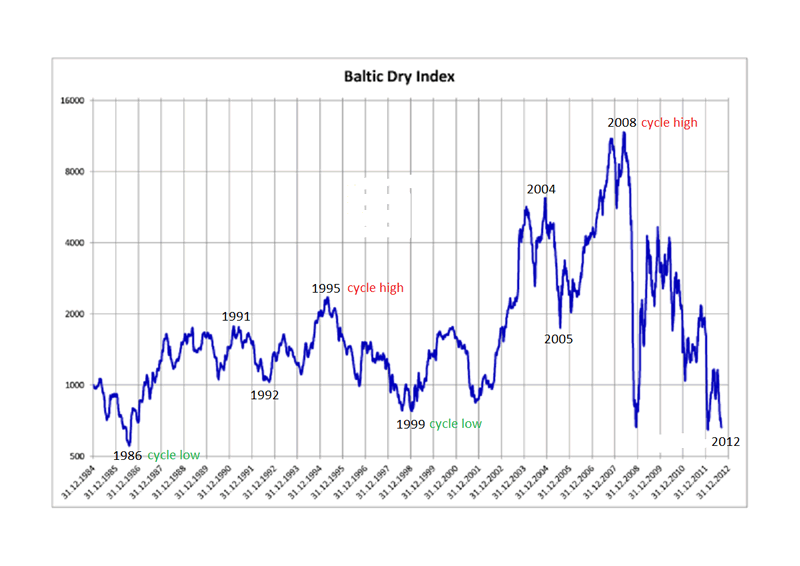
Rates peaked a few days after that report and started to decline. The decline retraced much of the 2013 gains, but rates again turned higher in the second half of that year. Right around November 2014, as we were preparing to write an update, rates turned down again. This downturn took the Baltic Dry Index (BDI) to its lowest level since the index was created in the 1980’s, exceeding the 554 reading in July, 1986. Clearly the 13 year cycle had been usurped by market forces: diminishing demand and oversupply of worldwide tonnage.
Undeterred we resumed our search to find some related identifiable index to help determine a turnaround in this industry. After all, every transportation industry goes through periods of cyclicality: the railroads, trucking, airlines, etc. The only one that has not recovered is the shipping industry, specifically the dry bulk sector. The shipping industry is much bigger than just dry bulk. There is the container sector, which has been having some goods years, and the tanker sector, which is currently in a boom. Late last year we uncovered the cyclical relationship for dry bulk. It has nothing to do with time. It has everything to do with price: supply and demand.
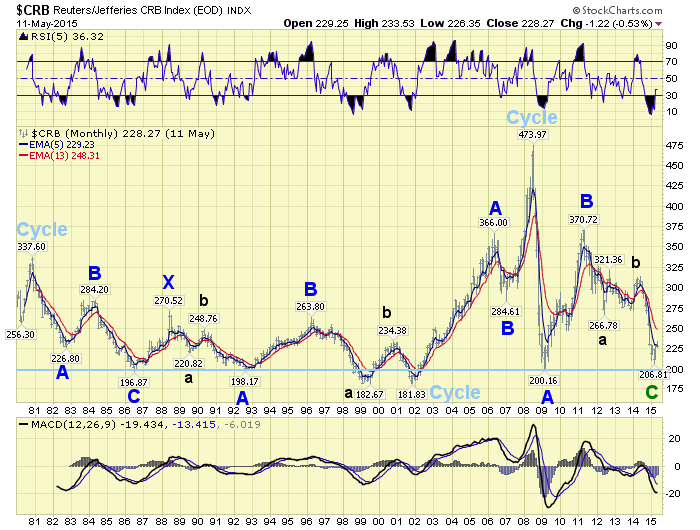
When one compares the historical CRB index with the BDI index one uncovers a near direct one to one relationship between commodity prices and shipping rates. Notice every primary and secondary low in the CRB index since 1986 has matched a primary and secondary low in the BDI index. Demand or scarcity of commodities, in general, drive up price and shipping rates. Lack of demand or oversupply of commodities, in general, drive down shipping rates. The comparisons are quite striking: 1986, 1989, 1992, 1999, 2001, 2009, 2012, 2015. The commodity cycle has the biggest direct relationship on the dry bulk sector.
Yesterday we published an update on Commodities. Commodities in general, using the more up to date GTX index, appear to have made a primary wave low and are turning higher. We estimate the upturn could last for a few years and commodities prices, in general, could rise more than 50% from their recent low. This would suggest shipping rates should now be on the rise. And they are!
Longer term we can also make some comparisons as well. During the 1970’s there was a huge commodity boom that peaked around 1980. Then when commodities entered a twenty year bear market the shipping industry entered turbulent times. As the bear market continued shipping companies started to declare bankruptcy as rates plunged, and the industry found itself with an oversupply of worldwide tonnage. This is exactly what has been going on in the industry during the past few years.
Notice how the CRB took six years from the 1980 peak to hit an ABC low, and then went into a trading range for the next 15 years into a Cycle low in 2001. When using the GTX the Cycle low actually ended in 1999. The BDI index made its cyclical low that year: 1986. As shipping companies continued to exit the business rates rose with commodity prices, and the shipping industry hit an equilibrium. Then when commodity prices went into a 15 year trading range, shipping rates went into a trading range but at elevated levels.
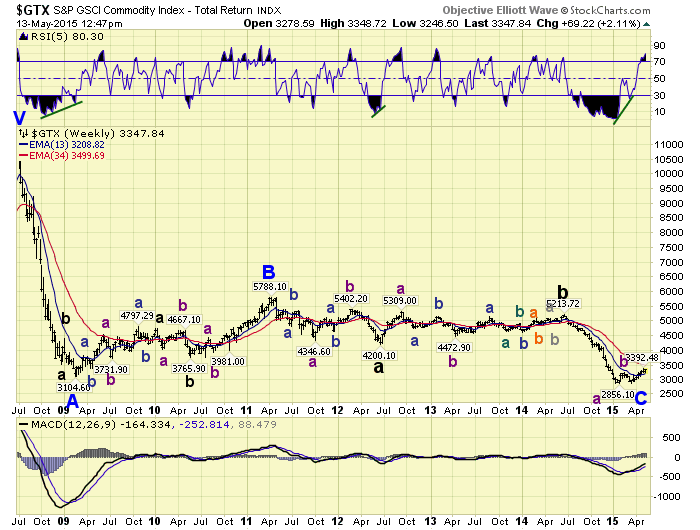
This time around commodity prices have been declining for seven years: 2008-2015. The GTX has just made an ABC low and prices have started to rise.
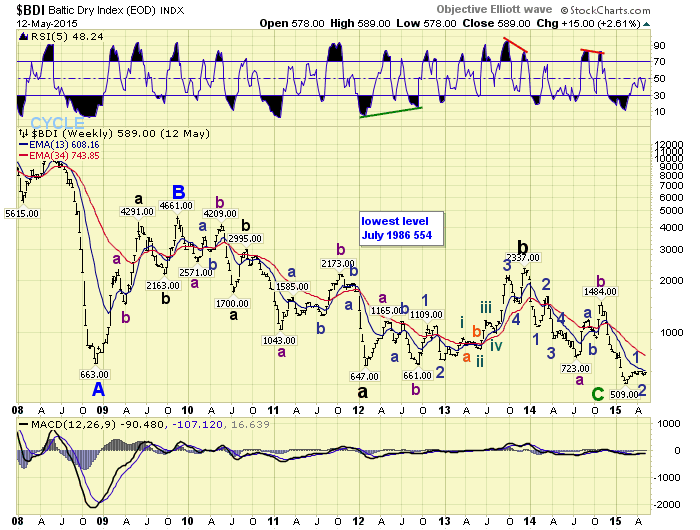
The BDI has also made a low, an all time low, and rates have begun to rise. This analysis suggests shipping rates may have just bottomed in a cyclical low. The BDI should now rise back up to the 2,000 level over the next couple of years.
During the rise, poorly managed or overleveraged shipping companies will continue to fold, as they have been doing for the past few years. Then when the next downturn in commodities occurs, shipping rates should decline to a higher low than 2015. Possibly entering the trading range they experienced during the late-1980’s and 1990’s. Well managed shipping companies should now begin to benefit.
If you would like to follow the BDI and the handful of shipping companies that we track, just review pages 15-16 using the following link: http://stockcharts.com/public/1269446/tenpp/15
After about 40 years of investing in the markets one learns that the markets are constantly changing, not only in price, but in what drives the markets. In the 1960s, the Nifty Fifty were the leaders of the stock market. In the 1970s, stock selection using Technical Analysis was important, as the market stayed with a trading range for the entire decade. In the 1980s, the market finally broke out of it doldrums, as the DOW broke through 1100 in 1982, and launched the greatest bull market on record.
Sharing is an important aspect of a life. Over 100 people have joined our group, from all walks of life, covering twenty three countries across the globe. It's been the most fun I have ever had in the market. Sharing uncommon knowledge, with investors. In hope of aiding them in finding their financial independence.
Copyright © 2015 Tony Caldaro - All Rights Reserved Disclaimer: The above is a matter of opinion provided for general information purposes only and is not intended as investment advice. Information and analysis above are derived from sources and utilising methods believed to be reliable, but we cannot accept responsibility for any losses you may incur as a result of this analysis. Individuals should consult with their personal financial advisors.
Tony Caldaro Archive |
© 2005-2022 http://www.MarketOracle.co.uk - The Market Oracle is a FREE Daily Financial Markets Analysis & Forecasting online publication.