


US Jobs Decline for 6th Consecutive Month Data
Economics / US Economy Jul 03, 2008 - 10:18 AM GMTBy: Mike_Shedlock

 Before taking a look at the monthly jobs data, let's take a look at weekly claims. The US Department of Labor is reporting Initial Unemployment Insurance Claims continue to rise.
Seasonally Adjusted
In the week ending June 28, the advance figure for seasonally adjusted initial claims was 404,000, an increase of 16,000 from the previous week's revised figure of 388,000. The 4-week moving average was 390,500, an increase of 11,250 from the previous week's revised average of 379,250.
Unadjusted
The advance number of actual initial claims under state programs, unadjusted, totaled 368,876 in the week ending June 28, an increase of 10,503 from the previous week. There were 300,348 initial claims in the comparable week in 2007.
Jobs Decline 6th Consecutive Months
This morning, the Bureau of Labor Statistics (BLS) released the June Employment Report . Jobs were negative for a 6th consecutive month. My target of 6% or higher stated unemployment by the end of the year remains on track. Here is a synopsis of that report.
Nonfarm payroll employment continued to trend down in June (-62,000), while the unemployment rate held at 5.5 percent, the Bureau of Labor Statistics of the U.S. Department of Labor reported today. Employment continued to fall in construction, manufacturing, and employment services, while health care and mining added jobs. Average hourly earnings rose by 6 cents, or 0.3 percent, over the month.
Establishment Data

The establishment data was the 6 consecutive decline.
Highlights
- 43,000 construction jobs were lost
- 33,000 manufacturing jobs were lost
- 8,000 retail trade jobs were lost
- 51,000 professional and business services jobs were lost
- 7,000 service providing jobs were added
- 24,000 leisure and hospitality jobs were added
- 29,000 government jobs were added
Last month education and health services added 54,000 jobs, this month 29,000. One month does not make a trend but this will be interesting to watch.
These are clearly recession totals yet still we have pundits debating whether or not we are in recession.
Birth/Death Model From Alternate Universe
This was a very weak jobs report. And once again the Birth/Death Model assumptions are from outer space.
Every month I say the same nearly the same thing. The only difference is the numbers change slightly. Here it is again: The BLS should be embarrassed to report this data. Its model suggests that there was 29,000 jobs coming from new construction businesses, 22,000 jobs coming from professional services, and a whopping 177,000 jobs in total coming from net new business creation. The economy has slowed to a standstill and the BLS model still has the economy expanding quite rapidly.
Repeating what I have been saying for months now, virtually no one can possibly believe this data. The data is so bad, I doubt those at the BLS even believe it. But that is what their model says so that is what they report.
BLS Black Box
For those unfamiliar with the birth/death model, monthly jobs adjustments are made by the BLS based on economic assumptions about the birth and death of businesses (not individuals). Those assumptions are made according to estimates of where the BLS thinks we are in the economic cycle.
The BLS has admitted however, that their model will be wrong at economic turning points. And there is no doubt we are long past an economic turning point.
With housing falling like a rock and commercial real estate now following suit, the BLS is assuming that 29,000 new jobs were added in construction. With lenders blowing up and countless self employed real estate professional exiting the business the BLS is assuming 22,000 jobs from professional and business services. The total number of jobs added in May by these absurd assumptions was 177,000 jobs.
No doubt you will see some who will subtract 177,000 jobs from -62,000 jobs and conclude that 239,000 jobs were lost in June. Such math is inaccurate.
Here is the pertinent snip from the BLS on Birth/Death Methodology.
- The net birth/death model component figures are unique to each month and exhibit a seasonal pattern that can result in negative adjustments in some months. These models do not attempt to correct for any other potential error sources in the CES estimates such as sampling error or design limitations.
- Note that the net birth/death figures are not seasonally adjusted, and are applied to not seasonally adjusted monthly employment links to determine the final estimate.
- The most significant potential drawback to this or any model-based approach is that time series modeling assumes a predictable continuation of historical patterns and relationships and therefore is likely to have some difficulty producing reliable estimates at economic turning points or during periods when there are sudden changes in trend.
The important point in this mess is that both the job data and employment data are much worse than appears at first glance (and the first glance looked horrid).
Table A-12
Table A-12 is where one can find a better approximation of what the unemployment rate really is. Let's take a look
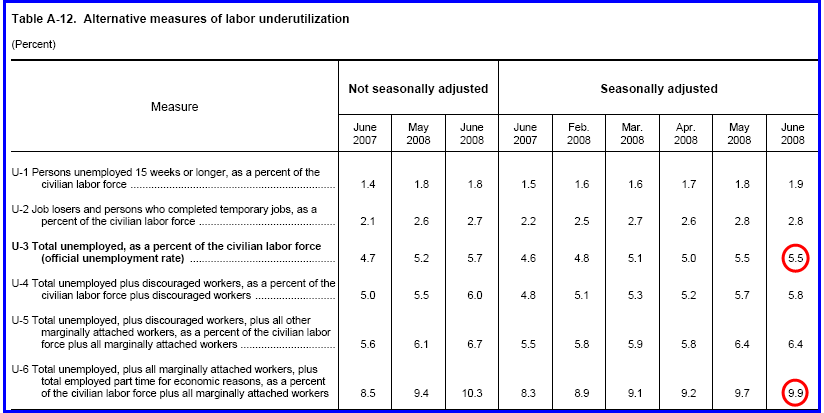
If you start counting all the people that want a job but gave up, all the people with part-time jobs that want a full-time job, etc., you get a closer picture of what the unemployment rate is. The official government number remained 5.5% after May's huge jump, but U-6 (the most inclusive number) rose .2 to 9.9%. To the average Joe on the street unemployment feels more like 10% than 5.5. Both numbers are poised to rise.
This report was the 6th consecutive contraction. Service jobs were only positive because 29,000 government jobs were created. Yesterday in Downward Spiral In Jobs I commented on interesting stats from the ADP Small Business Report giving a breakdown of jobs by size of firm. Inquiring minds will want to take a look.
By Mike "Mish" Shedlock
http://globaleconomicanalysis.blogspot.com
Click Here To Scroll Thru My Recent Post List
Mike Shedlock / Mish is a registered investment advisor representative for SitkaPacific Capital Management . Sitka Pacific is an asset management firm whose goal is strong performance and low volatility, regardless of market direction.
Visit Sitka Pacific's Account Management Page to learn more about wealth management and capital preservation strategies of Sitka Pacific.
I do weekly podcasts every Thursday on HoweStreet and a brief 7 minute segment on Saturday on CKNW AM 980 in Vancouver.
When not writing about stocks or the economy I spends a great deal of time on photography and in the garden. I have over 80 magazine and book cover credits. Some of my Wisconsin and gardening images can be seen at MichaelShedlock.com .
© 2008 Mike Shedlock, All Rights Reserved
Mike Shedlock Archive |
© 2005-2022 http://www.MarketOracle.co.uk - The Market Oracle is a FREE Daily Financial Markets Analysis & Forecasting online publication.
Comments
|
Jeff
06 Jul 08, 21:32 |
Bush Job Losses
5.8 MILLION jobs have been lost during the Bush Administration. |