


Crude Oil Price Double Top or Further Rally?
Commodities / Crude Oil Apr 26, 2016 - 03:15 PM GMTBy: Nadia_Simmons

 Trading position (short-term; our opinion): Short positions (with a stop-loss order at $48.56 and initial downside target at $35.24) are justified from the risk/reward perspective.
Although crude oil increased after the market's open, approaching Thursday's high, the commodity gave up some gains in the following hours weakened by the strengthening U.S. dollar. Thanks to these circumstances, light crude closed another day under the resistance line. Will it be strong enough to stop oil bulls in the coming days?
Although Friday's Baker Hughes' report showed that the number of active U.S. oil rigs dropped by 8 to 343, posting a fifth consecutive week of declines, the strengthening U.S. dollar pushed the commodity lower, making light crude less attractive for buyers holding other currencies. As a result, crude oil closed another day under the resistance line based on the previous highs. Will it be strong enough to stop oil bulls in the coming days? Let's examine charts and try to answer this question (charts courtesy of http://stockcharts.com).
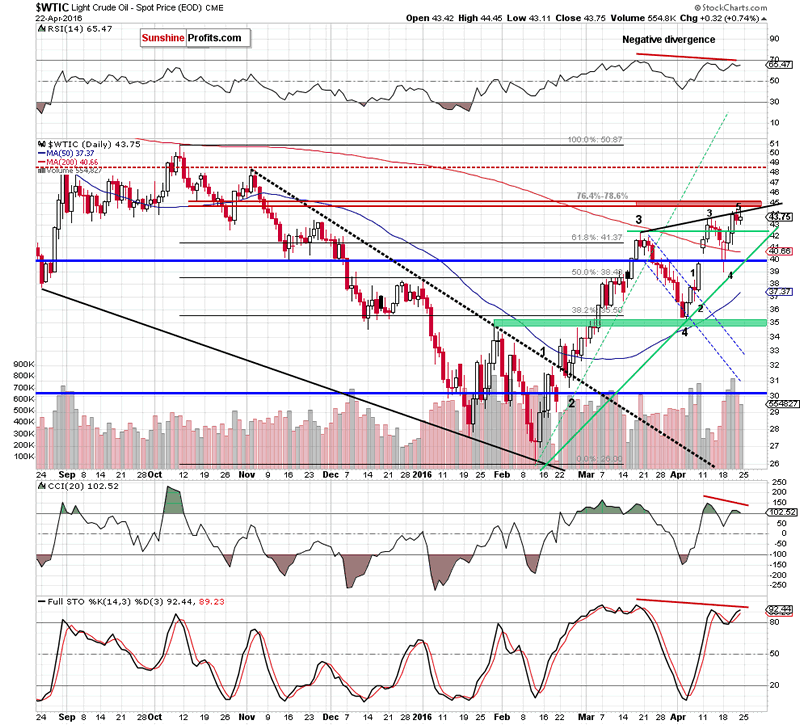
Looking at the daily chart, we see that although crude oil moved little higher after the market's open, oil bulls didn't manage to push the commodity above the Thursday's high, which resulted in a pullback. With this move, light crude slipped under the black resistance line based on the previous high and closed another day below it, which increases the importance of this line.
Will it be strong enough to stop further rally? From today's point of view, we see that this black line is slightly below the solid resistance zone, which suggests that reversal and lower values of light crude are just around the corner. Why? We think that the best answer to this question will be quotes from our Thursday's alert:
(...) In our previous assumption, we wrote that the first wave and the potential fifth wave are quite similar in terms of length and time. Nevertheless, as it turned out, the recent rally pushed crude oil to a new peak, suggesting that the fifth wave may be about 161.8% greater than the first wave. If this is the case, we may see another upswing even to around $44.83 in the coming days (additionally, if we consider the last upward move (since Apr 5) we can also discern five waves). At this point it is worth noting that in this area (around $45-$45.60) is also the red resistance zone created by the 76.4% and 78.6% Fibonacci retracement levels based on the Oct-Feb downward move, which could encourage oil bears to act.
Once we know the above, we would like to draw your attention to Fibonacci extensions based on earlier pullbacks. Firstly, when we consider the downward move from mid-March high of $42.49 to Apr low of $35.24, we see that the first important extension (127.2%) is around $44.46. Secondly, when we analyze extensions based on the recent decline (from $43.69 to $39), we notice that the 127.2% extension is around $44.96. Connecting the dots, both extensions are very close to current levels and the red resistance zone, which increases the likelihood of reversal in the coming day(s).
On top of that, there are negative divergences between the CCI, the Stochastic Oscillator and the price of the commodity, which could be an additional signal for oil bears.
(...) we would also like to comment the current situation in the oil-to-gold and oil-to-silver ratios.
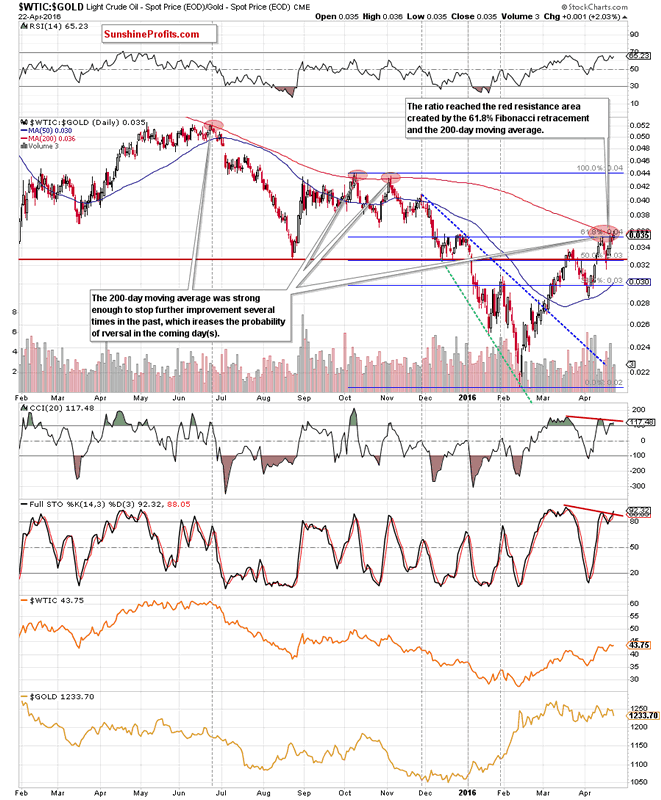
Looking at the above chart, we see that the ratio reached the red resistance zone created by the 61.8% Fibonacci retracement (based on the Oct-Feb downward move) and the 200-day moving average. As you see several times in the past, this important moving average was strong enough to stop further improvement (even if we saw small and very short-lived breakouts above it), which increases the probability of reversal in the coming day(s). Additionally, there are bearish divergences between the CCI, Stochastic Oscillator and the ratio, which may be another factor that will encourage oil bears to action in near future.
On top of that when we zoom out our picture, we notice one more interesting fact.
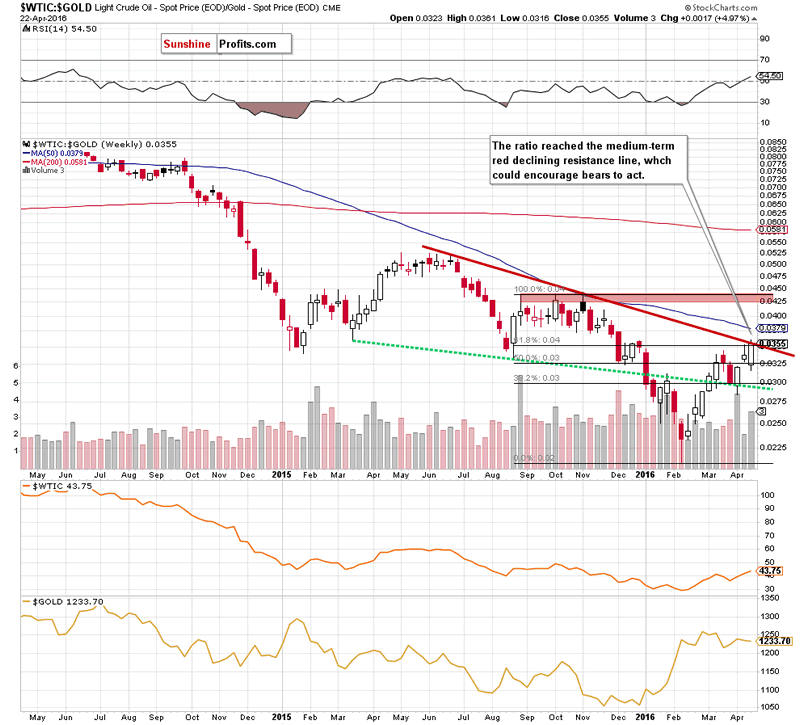
From this perspective, we see that the ratio reached the medium-term red declining resistance line, which is another pro-bearish factor, which could trigger a reversal in near future.
Once we know the current situation in the above ratio, let's focus on the relationship between black gold and silver.
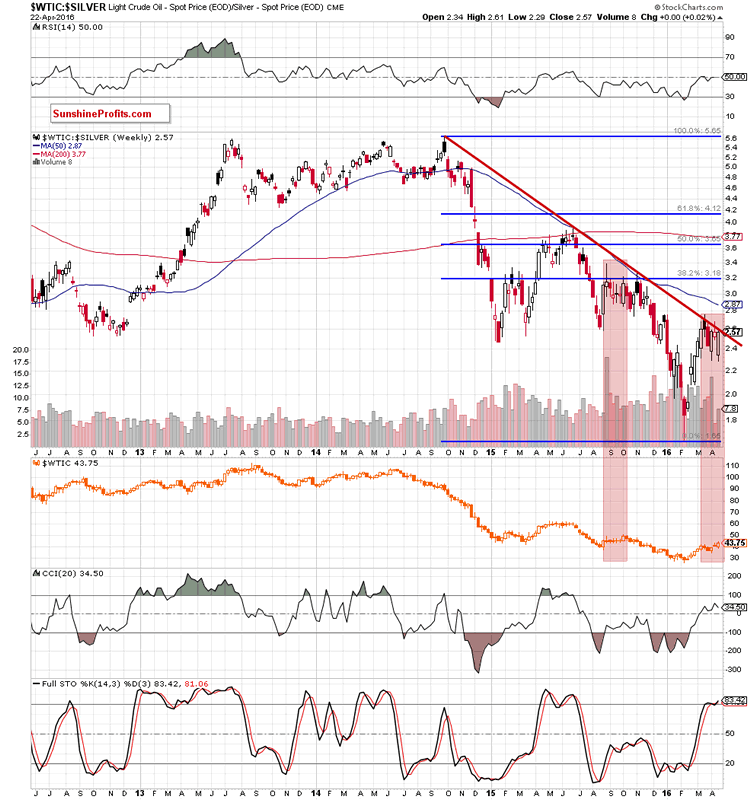
The first thing that catches the eye on the above chart is negative divergence between the ratio and the price of crude oil. When we took a closer look at the chart we noticed similar situation in the previous year. Back then, such price action preceded declines in the commodity, which suggests that history may repeat itself once again - especially when we factor in the proximity to the long-term red declining resistance line and high reading of the Stochastic Oscillator.
Summing up, although crude oil moved higher once again, oil bulls didn't manage to push the commodity above the previous high, which resulted in a drop under the black resistance line based on the previous highs. Taking this fact into account, and combining it with the proximity to the red resistance zone (marked on the daily chart), the current situation in the oil-to-gold and oil-to-silver rations, negative divergences between indicators and the price of crude oil (and also between indicators and the value of both ratios) we believe that the space for gains seems limited and reversal in the coming week is very likely.
Very short-term outlook: bearish
Short-term outlook: bearish
MT outlook: mixed with bearish bias
LT outlook: mixed
Trading position (short-term; our opinion): Short positions (with a stop-loss order at $48.56 and initial downside target at $35.24) are justified from the risk/reward perspective. We will keep you informed should anything change, or should we see a confirmation/invalidation of the above.
As a reminder - "initial target price" means exactly that - an "initial" one, it's not a price level at which we suggest closing positions. If this becomes the case (like it did in the previous trade) we will refer to these levels as levels of exit orders (exactly as we've done previously). Stop-loss levels, however, are naturally not "initial", but something that, in our opinion, might be entered as an order.
Since it is impossible to synchronize target prices and stop-loss levels for all the ETFs and ETNs with the main market that we provide this level for (crude oil), the stop-loss level and target price for popular ETN and ETF (among other: USO, DWTI, UWTI) are provided as supplementary, and not as "final". This means that if a stop-loss or a target level is reached for any of the "additional instruments" (DWTI for instance), but not for the "main instrument" (crude oil in this case), we will view positions in both crude oil and DWTI as still open and the stop-loss for DWTI would have to be moved lower. On the other hand, if crude oil moves to a stop-loss level but DWTI doesn't, then we will view both positions (in crude oil and DWTI) as closed. In other words, since it's not possible to be 100% certain that each related instrument moves to a given level when the underlying instrument does, we can't provide levels that would be binding. The levels that we do provide are our best estimate of the levels that will correspond to the levels in the underlying assets, but it will be the underlying assets that one will need to focus on regarding the sings pointing to closing a given position or keeping it open. We might adjust the levels in the "additional instruments" without adjusting the levels in the "main instruments", which will simply mean that we have improved our estimation of these levels, not that we changed our outlook on the markets.
Thank you.
Nadia Simmons
Forex & Oil Trading Strategist
Przemyslaw Radomski
Founder, Editor-in-chief
Sunshine Profits: Gold & Silver, Forex, Bitcoin, Crude Oil & Stocks
Stay updated: sign up for our free mailing list today
* * * * *
Disclaimer
All essays, research and information found above represent analyses and opinions of Nadia Simmons and Sunshine Profits' associates only. As such, it may prove wrong and be a subject to change without notice. Opinions and analyses were based on data available to authors of respective essays at the time of writing. Although the information provided above is based on careful research and sources that are believed to be accurate, Nadia Simmons and his associates do not guarantee the accuracy or thoroughness of the data or information reported. The opinions published above are neither an offer nor a recommendation to purchase or sell any securities. Nadia Simmons is not a Registered Securities Advisor. By reading Nadia Simmons’ reports you fully agree that he will not be held responsible or liable for any decisions you make regarding any information provided in these reports. Investing, trading and speculation in any financial markets may involve high risk of loss. Nadia Simmons, Sunshine Profits' employees and affiliates as well as members of their families may have a short or long position in any securities, including those mentioned in any of the reports or essays, and may make additional purchases and/or sales of those securities without notice.
© 2005-2022 http://www.MarketOracle.co.uk - The Market Oracle is a FREE Daily Financial Markets Analysis & Forecasting online publication.