


Violent US Bond Market Selloff: An Eye-Opening Perspective
Interest-Rates / US Bonds Dec 08, 2016 - 04:27 AM GMTBy: EWI

 In Elliott wave terms, bond investors have transitioned from extreme optimism to extreme pessimism
[Editor's Note: The text version of the story is below.]

*********
What a rout in the bond market in November (Bloomberg, Dec. 1):
Global Bonds Suffer Worst Monthly Meltdown as $1.7 Trillion Lost
The price of U.S. Treasuries nosedived as 10-year yields -- a.k.a., interest rates, which move inversely to bond prices -- saw their steepest climb since November 2009.
Bloomberg (Dec. 1) provides another perspective:
The 30-year-old bull market in bonds looks to be ending with a bang. The Bloomberg Barclays Global Aggregate Total Return Index lost 4 percent in November, the deepest slump since the gauge's inception in 1990. Treasuries extended declines Dec. 1.
Elliott Wave International subscribers were prepared well ahead of time.
On June 17, well before the rout, The Elliott Wave Theorist showed this chart and said:
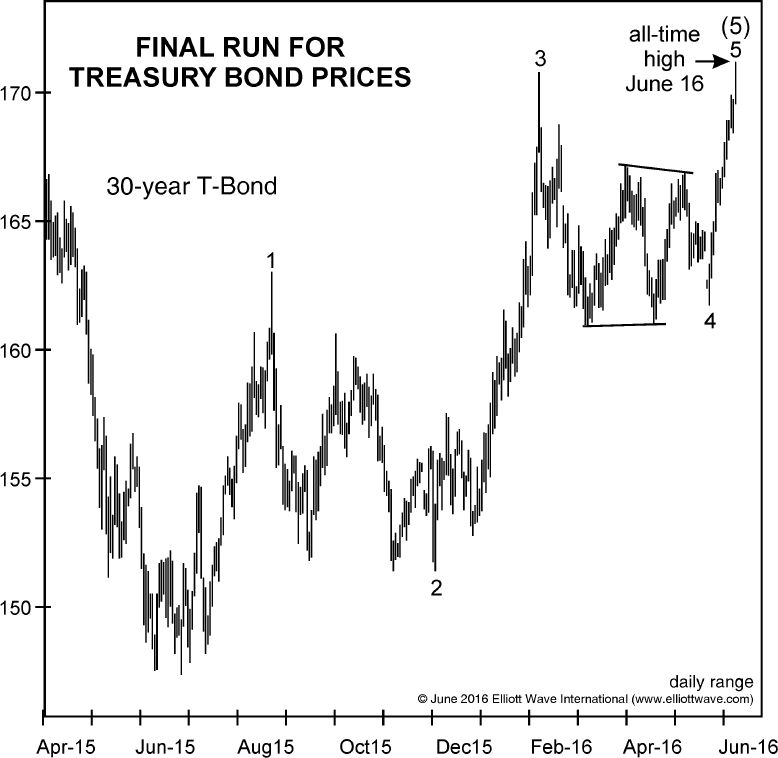
The 30-year Treasury bond made a new all-time high on June 16. The triangle is indicative of a fourth wave, making the recent thrust a fifth wave.
This wave count is terminal. Bonds are on their last leg.
But, at the time, most speculators disagreed. Even so, bond prices topped less than a month later. Said our U.S. Short Term Update on July 25:
The wave structure of the rally ended at the 177^11.0 high on July 11. Sentiment remains historically optimistic. The most recent tally of the Commitment of Traders data shows that Large Speculators (trend-followers) remains a tad off a 21-year record net long extreme in the percentage (of open interest) of bond futures and options contracts they hold. With Commercials taking the opposite side of this trade, the sentiment set up is in place for a continued bond price decline .
Despite the historic optimism, Treasury bond prices continued to decline.
This week, as of Dec. 1, the 30-year yield rose to as high as 3.15%. That's a 51% climb since the July low of 2.085%.
In other words, in the short term, the market sentiment in bonds has transitioned from a highly elevated optimism four months ago to a deep pessimism we see this week. In fact, the 30-day bond Daily Sentiment Index (trade-futures.com), which our U.S. Short Term Update quotes quite often, is at its lowest level since September 2013 – a contrarian indicator.
Investor psychology could grow even more negative toward bonds. But, keep in mind that countertrend moves in financial markets usually occur when sentiment reaches an extreme like the one we’re seeing now.
Put differently, the 30-year Treasury bond's price pattern is again looking highly interesting -- although, again, in the opposite way most investors expect.
Unleash the power of the Wave PrincipleMuch like a great sports play; to appreciate a great market forecast, you have to see it. In fact, we'd like to show you four. Our examples do indeed show what can happen when Elliott analysis meets opportunity. But we're not asking you to attend a class in 'good calls.' In each of these four markets, the unfolding trends have (once again) reached critical junctures. You really, really want to see what we see, right now. Get your report -- How to Find Real Opportunities in the Markets You Trade -- FREE |
This article was syndicated by Elliott Wave International and was originally published under the headline Violent Bond Selloff: An Eye-Opening Perspective. EWI is the world's largest market forecasting firm. Its staff of full-time analysts led by Chartered Market Technician Robert Prechter provides 24-hour-a-day market analysis to institutional and private investors around the world.
About the Publisher, Elliott Wave International
Founded in 1979 by Robert R. Prechter Jr., Elliott Wave International (EWI) is the world's largest market forecasting firm. Its staff of full-time analysts provides 24-hour-a-day market analysis to institutional and private investors around the world.
© 2005-2022 http://www.MarketOracle.co.uk - The Market Oracle is a FREE Daily Financial Markets Analysis & Forecasting online publication.