


SPX Corrective Pattern Continues
Stock-Markets / Stock Market 2017 Apr 08, 2017 - 03:08 PM GMTBy: Tony_Caldaro

 The market started the week at SPX 2363. On Monday the market opened higher but dropped down to SPX 2345. Before the day ended the market had turned around, and then rallied to SPX 2378 by Wednesday. Then after a decline to SPX 2349 by early Thursday, the market hit 2364 late, and then again on Friday, before ending the week at 2356. For the week the SPX/DOW lost 0.15%, and the NDX/NAZ lost 0.45%. Economic reports for the week were slightly positive. On the downtick: ISM manufacturing/services, auto sales, monthly payrolls, the WLEI and the Q1 GDP estimate. On the uptick: construction spending, factory orders, the ADP, wholesale inventories, consumer credit; plus the unemployment rate, trade deficit and weekly jobless claims all improved. Next week’s reports will be highlighted by the CPI/PPI and retail sales.
LONG TERM: uptrend
For the past several weeks the market has made a series of lower highs and lower lows. A technical definition of a downtrend. In fact, the market activity from the March 1st all-time high of SPX 2401 looks somewhat similar to the August-November Minor 2 correction. Which also unfolded in a series of lower highs and lower lows; see daily chart. Minor wave 2 was a technical correction leading up to the uncertainty of the election. This potential Minor wave 4 also looks like a technical correction involving the uncertain outcome of Trump’s platform policies. Minor 2 ended with a final washout just before the election. This potential Minor 4 may also end with a final washout as well.
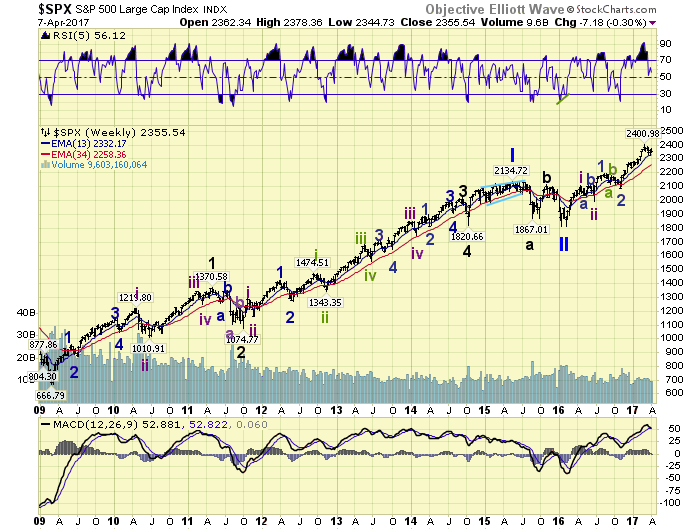
Longer term the bull market remains intact and the count remains unchanged. A Major wave 1, of Primary III, bull market has been underway since the February 2016 SPX 1810 low. Thus far Intermediate waves i and ii have completed, and Minor waves 1 and 2 have completed. Minor wave 3 may have also recently completed at the SPX 2401 high, and Minor 4 may have been underway since then. When OEW signals a downtrend confirmed, it is likely that the correction will be nearly over. This kind of activity has happened quite often in the past 8 years. It will also confirm that Minor 3 did complete and Minor 4 is close to completion as well. When Minor wave 5 does begin it will take the market to all-time new highs.
MEDIUM TERM: uptrend under pressure
We have been tracking a short term count, within the Minor 3 uptrend, that is posted on the hourly chart in the short term section. As noted last weekend, sometimes these counts can be off. This week we offered an alternate to that count as posted on the daily chart below. This count suggests five waves were completed at the SPX 2401 high, and a Minor wave 4 correction is underway now. It is labeled in green as it is a tentative count. Should the market breakout to the upside, and make new highs, this alternate count would be negated. Should the market breakdown through the recent SPX 2322 low this count would be preferred.
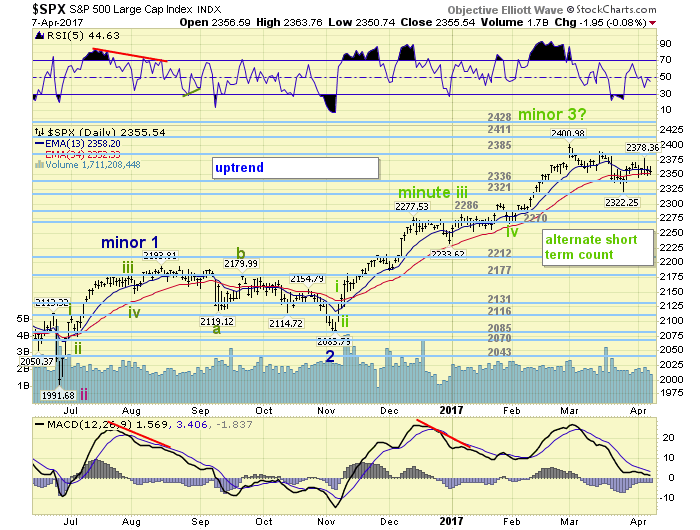
Under a worse case scenario we see the following levels of support for a Minor wave 4 correction. First support would be between the OEW 2270 and 2286 pivot ranges, which represents about a 38.2% retracement of Minor 3. Second support would be around SPX 2234, which represents about a 50.0% retracement of Minor 4. It is unlikely the market will decline much more than that. Corrections during this bull market have been limited to about 110-130 points, or about 5% so far. Medium term support is at the 2336 and 2321 pivots, with resistance at the 2385 and 2411 pivots.
SHORT TERM
The hourly chart below suggests the SPX is currently in Micro wave 5 of Minute wave iii. This count would require the SPX holding around 2350 on any further pullbacks. Any drop down to the 2336 and 2321 pivots would very likely eliminate this count. On the chart we display a little triangle around Micro wave 2. That triangle is not applicable to this count, but the alternate count.
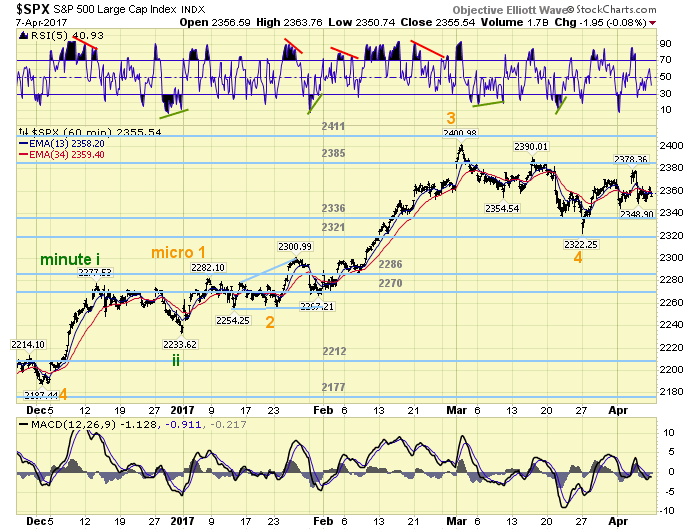
The alternate count suggests five waves up from SPX 2084 to SPX 2401 completing the Minor wave 3 uptrend. The count is as follows: Minute i 2147, Minute ii 2125, Minute iii 2282, Minute iv 2267, and Minute v 2401. Minute iv was an expanding triangle as noted on the chart above, which would have been difficult to anticipate in real time. We continue to urge a bit of caution until this corrective looking pattern completes, or breaks out. Short term support is at the 2336 and 2321 pivots, with resistance at the 2385 and 2411 pivots. Short term momentum ended the week just below neutral.
FOREIGN MARKETS
Asian markets were mostly higher and gained 0.3%.
European markets were mixed and lost 0.1%.
The DJ World index lost 0.4%, as did the NYSE index.
COMMODITIES
Bonds are in an uptrend and gained 0.3%.
Crude appears to be in an uptrend and gained 3.2%.
Gold appears to be in an uptrend and gained 0.5%.
The USD, oddly enough, also appears to be in an uptrend and gained 0.9%.
NEXT WEEK
Monday: FED chair Yellen gives a speech after the market closes. Wednesday: export/import prices and budget deficit. Thursday: weekly jobless claims and the PPI. Friday: the CPI, consumer sentiment, retail sales, and business inventories.
CHARTS: http://stockcharts.com/public/1269446/tenpp
After about 40 years of investing in the markets one learns that the markets are constantly changing, not only in price, but in what drives the markets. In the 1960s, the Nifty Fifty were the leaders of the stock market. In the 1970s, stock selection using Technical Analysis was important, as the market stayed with a trading range for the entire decade. In the 1980s, the market finally broke out of it doldrums, as the DOW broke through 1100 in 1982, and launched the greatest bull market on record.
Sharing is an important aspect of a life. Over 100 people have joined our group, from all walks of life, covering twenty three countries across the globe. It's been the most fun I have ever had in the market. Sharing uncommon knowledge, with investors. In hope of aiding them in finding their financial independence.
Copyright © 2017 Tony Caldaro - All Rights Reserved Disclaimer: The above is a matter of opinion provided for general information purposes only and is not intended as investment advice. Information and analysis above are derived from sources and utilising methods believed to be reliable, but we cannot accept responsibility for any losses you may incur as a result of this analysis. Individuals should consult with their personal financial advisors.
Tony Caldaro Archive |
© 2005-2022 http://www.MarketOracle.co.uk - The Market Oracle is a FREE Daily Financial Markets Analysis & Forecasting online publication.