


Stock Market Grand Super Cycle Overview While SPX Correction Continues
Stock-Markets / Stock Market 2017 Apr 23, 2017 - 04:14 AM GMTBy: Tony_Caldaro

 The market started this gap filled week at SPX 2329. A gap up opening Monday took the SPX to 2349. Then after a gap down opening on Tuesday the market found support at SPX 2335. A gap up opening on Wednesday took the SPX to 2353, which was sold off into 2335 again. On Thursday another gap up opening took the market to SPX 2361. Then the market pulled back to SPX 2349 on Friday. For the week the SPX/DOW gained 0.70%, and the NDX/NAZ gained 1.75%. Economic reports for the week were mixed. On the downtick: the NY/Philly FED, the WLEI, the NAHB, housing starts, plus weekly jobless claims rose. On the uptick: building permits, industrial production, capacity utilization, leading indicators and existing home sales. Next week’s reports will be highlighted by Q1 GDP, the Chicago PMI, durable goods and housing. Best to your week!
LONG TERM: uptrend
This week let’s look at the big picture. The very big picture. While published data on the US stock market only began in the year 1885, we have been able to piece together, using secular Saeculum cycles and economic cycles, how the US market would have looked from the early 1700’s. As an emerging growth economy the US would have not looked anything like the European markets that do have stock market data going back that far. That data was not considered.
From around the year 1700 to 1929 the US experienced a 200+ year grand super cycle bull market GSC 1. The 1929-1932 crash, when the stock market lost nearly 90% of its value, ended GSC 2. While short in time the crash made up for it in price damage. A GSC 3 bull market began at that 1932 low.
Within GSC 1 there were five super cycles, approximately: SC1 1700-1770, SC2 1770-1776, SC3 1776-1850, SC4 1850-1857, and SC5 1857-1929. Within the current GSC 3 there have been two completed super cycles, with the third underway: SC1 1932-2007, SC2 2007-2009, SC3 2009-xxxx. Since super cycle bull markets last 70+ years, this SC3 is not likely to top until around the year 2080.
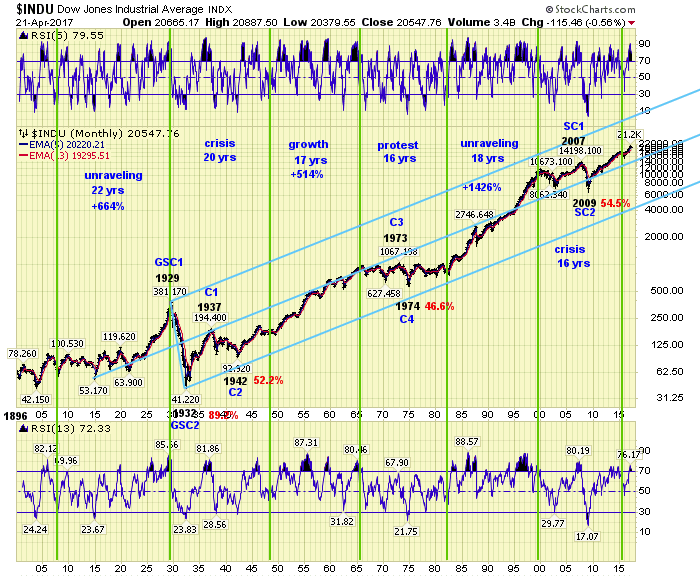
Within each super cycle bull market there are five Cycle waves. SC1 of GSC 3 divided as follows: C1 1932-1937, C2 1937-1942, C3 1942-1973, C4 1973-1974 and C5 1974-2007. Notice the Cycle wave bull markets can be as short as 5 years or as long as 30+ years. Also note, no matter the wave degree the bear markets are always much shorter in time than the bull markets. Currently the US stock market is in Cycle wave 1, from the 2009 low, of SC1. Which brings us up to the present.
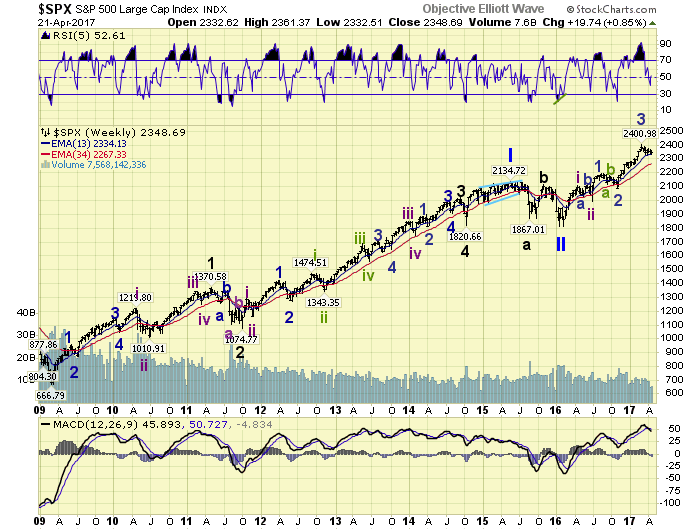
Cycle wave bull markets unfold in five Primary waves. During this C1 bull market: P1 2009-2015, P2 2015-2016, and P3 currently underway. Thus far, from the 2016 low, we have Int. waves i and ii Apr-Jun 2016, Minor waves 1 and 2 Aug-Nov 2016, and Minor 3 completed in March, with Minor 4 underway now. When Minor 4 concludes Minor 5 should take the market to new highs to complete Int. iii. Then after an Int. iv correction, Int. v would only complete Major wave 1 of Primary III. As you can observe, Primary III should last quite a while as Major waves 1-2-3-4-5 unfold. For now we looking for a Major wave 1 high in one-three years around SPX 3000+.
MEDIUM TERM: downtrend
The Minor wave 3 uptrend travelled from SPX 2084-2401 during Nov-Mar. The uptrend was the longest and strongest of the three impulsive uptrends in this bull market. After the March high the market entered a Minor 4 correction. Thus far it has lasted nearly two months and has only corrected 3.3%. Quite a small correction even for this bull market. With the two previous corrections declining 5.6% and 5.0% this one probably has more downside to go.
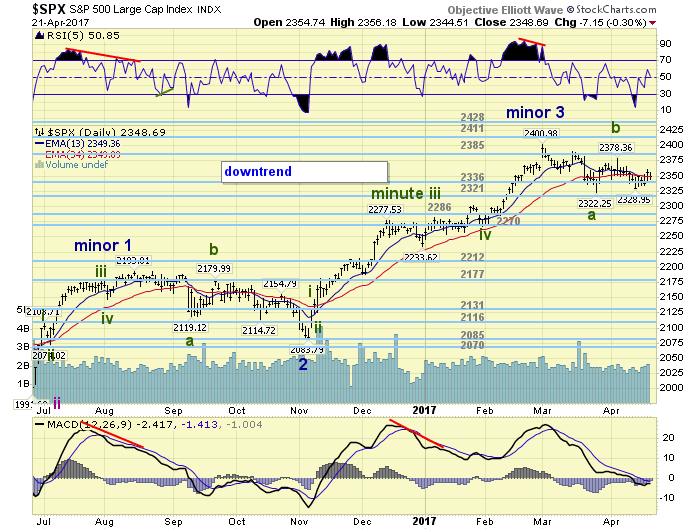
We have been labeling this downtrend from SPX 2401 as three Minute waves: 2322-2379-2329 so far. With Minute C underway we have anticipated downtrend support in the SPX 2290’s, and the OEW 2286 to 2270 pivot ranges. We are also waiting for the NDX/NAZ to confirm downtrends. They have dipped but continue to remain near their highs. A selloff in this sector should be all that is required to put in a downtrend low across the board. Medium term support remains at the 2336 and 2321 pivots, with resistance at the 2385 and 2411 pivots.
SHORT TERM
The market has been quite choppy, with a downward bias, since the SPX topped at 2401 in early March. After the Minor wave 4 downtrend was confirmed a week ago, the short term pattern within the downtrend was upgraded. Within this Minute a-b-c pattern we have noticed this week some symmetry.
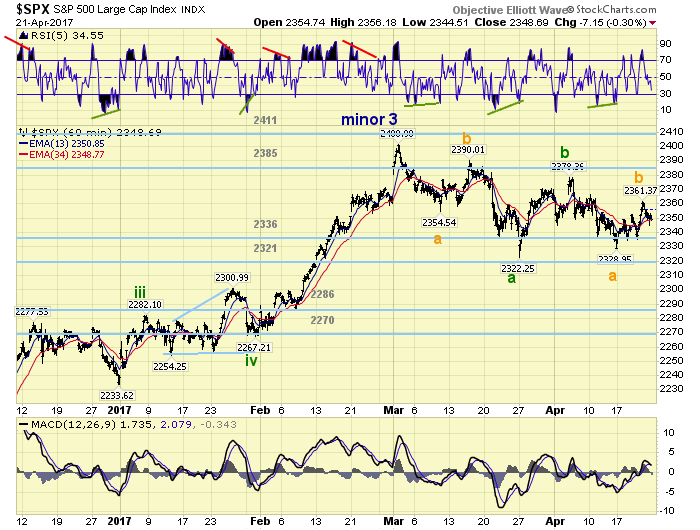
Minute ‘a’ divided into three waves: 2355-2390-2322. Minute ‘b’ was also three waves reaching a 2379 high. Minute ‘c’ now looks like three waves as well: 2329-2361-underway. When we examine the three wave decline of ‘a’ in points: 46-35-68. The three wave decline of ‘c’ in points is thus far: 49-32-xx. Notice the smaller a and b, of Minute waves ‘a’ and ‘c’ are quite similar. Also similar is the time element in days: 6-4-8 and 6-4-x. Should the market continue to maintain this symmetry, the SPX should bottom in the 2290’s around May 2nd. Short term support is at the 2336 and 2321 pivots, with resistance at the 2385 and 2411 pivots. Short term momentum ended the week below neutral. Best to your trading!
FOREIGN MARKETS
Asian markets were mostly lower for a net 0.8% loss.
European markets were also mostly lower and lost 0.7%.
The DJ World index gained 0.6%, as did the NYSE.
COMMODITIES
Bonds remain in an uptrend and gained 0.1%.
Crude is in a downtrend and lost 6.7%.
Gold is in an uptrend and gained 0.1%.
The USD is in a downtrend and lost 0.7%.
NEXT WEEK
Tuesday: Case-Shiller, new home sales and consumer confidence. Thursday: weekly jobless claims, durable goods and pending home sales. Friday: Q1 GDP (est. 1.0%), the Chicago PMI, and consumer sentiment.
CHARTS: http://stockcharts.com/public/1269446/tenpp
After about 40 years of investing in the markets one learns that the markets are constantly changing, not only in price, but in what drives the markets. In the 1960s, the Nifty Fifty were the leaders of the stock market. In the 1970s, stock selection using Technical Analysis was important, as the market stayed with a trading range for the entire decade. In the 1980s, the market finally broke out of it doldrums, as the DOW broke through 1100 in 1982, and launched the greatest bull market on record.
Sharing is an important aspect of a life. Over 100 people have joined our group, from all walks of life, covering twenty three countries across the globe. It's been the most fun I have ever had in the market. Sharing uncommon knowledge, with investors. In hope of aiding them in finding their financial independence.
Copyright © 2017 Tony Caldaro - All Rights Reserved Disclaimer: The above is a matter of opinion provided for general information purposes only and is not intended as investment advice. Information and analysis above are derived from sources and utilising methods believed to be reliable, but we cannot accept responsibility for any losses you may incur as a result of this analysis. Individuals should consult with their personal financial advisors.
Tony Caldaro Archive |
© 2005-2022 http://www.MarketOracle.co.uk - The Market Oracle is a FREE Daily Financial Markets Analysis & Forecasting online publication.