


Stocks Fluctuate Along Record Highs - Topping Pattern Or Just Pause? 22nd May
Stock-Markets / Stock Market 2017 May 22, 2017 - 02:22 PM GMTBy: Paul_Rejczak

 Briefly: In our opinion, speculative short positions are favored (with stop-loss at 2,410, and profit target at 2,200, S&P 500 index).
Our intraday outlook is bearish, and our short-term outlook is bearish. Our medium-term outlook remains neutral, following S&P 500 index breakout above last year's all-time high:
Intraday outlook (next 24 hours): bearish
Short-term outlook (next 1-2 weeks): bearish
Medium-term outlook (next 1-3 months): neutral
Long-term outlook (next year): neutral
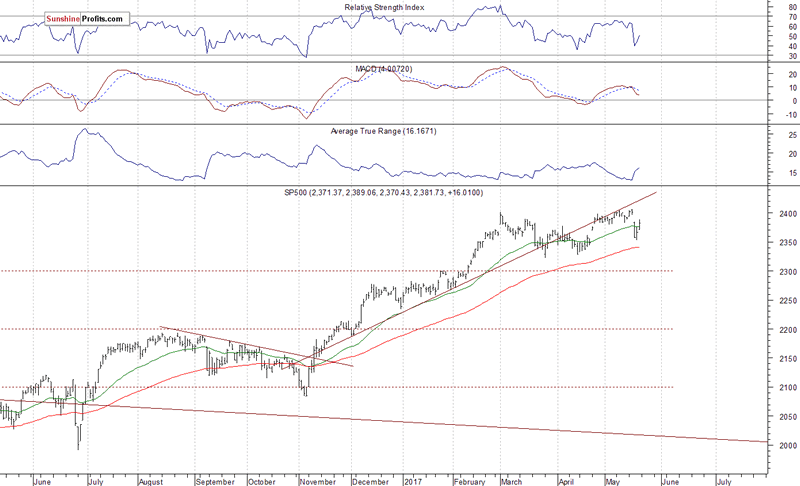
The main U.S. stock market indexes gained between 0.5% and 0.7% on Friday, retracing their Wednesday's move down, as investors' sentiment further improved following economic data releases, among others. The S&P 500 index has reached new record high of 2,405.77 on Tuesday. However, it failed to continue the uptrend and sold off on Wednesday, following a gap down opening of the trading session. Is last week's Thursday-Friday rebound an upward reversal or just correction within a new short-term downtrend? The Dow Jones Industrial Average closed slightly the level of 20,800, and the technology Nasdaq Composite index got closer to the level of 6,100 again. The nearest important level of support of the S&P 500 index is now at 2,370, marked by short-term local low. The next support level is at 2,350-2.355, marked by late April daily gap up, among others. The support level is also at 2,320-2,330, marked by previous local lows. On the other hand, resistance level is now at around 2,385-2,395, marked by Wednesday's daily gap down of 2,384.87-2,396.05. The resistance level is also at 2,400-2,405, marked by the above-mentioned new record high. Is this a topping pattern before medium-term downward reversal? The uptrend accelerated on March 1 and it looked like a blow-off top pattern accompanied by some buying frenzy. The S&P 500 index trades below its medium-term upward trend line, as we can see on the daily chart:
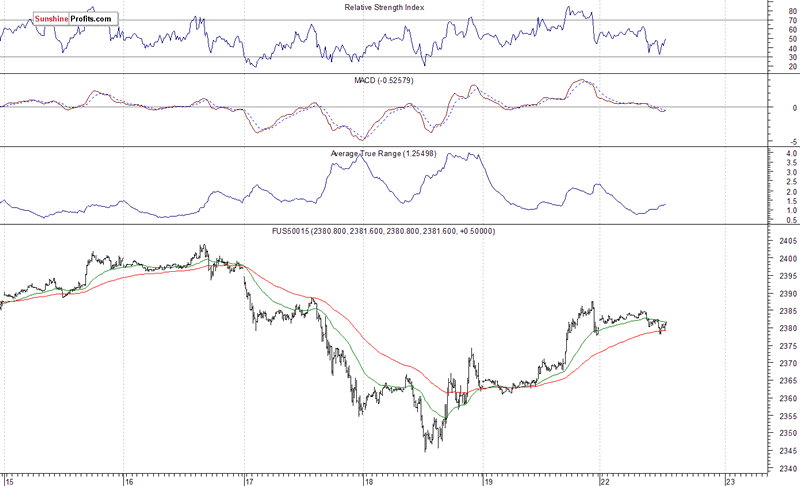
Expectations before the opening of today's trading session are virtually flat, following an overnight consolidation. The European stock market indexes have been mixed so far. There will be no new important economic data announcements today. The S&P 500 futures contract trades within an intraday consolidation, as it fluctuates along the level of 2,380. It has retraced some more of its last Wednesday's decline. The nearest important level of resistance is at around 2,385-2,390, marked by short-term local highs. The next level of resistance is at 2400-2,405, marked by topping consolidation along record high. On the other hand, support level is at around 2,370, marked by recent local high. the next level of support is at 2,340-2,345, marked by last week's local lows. The market trades within a short-term uptrend off Thursday's overnight lows. Is this a new uptrend or just an upward correction before another leg down?
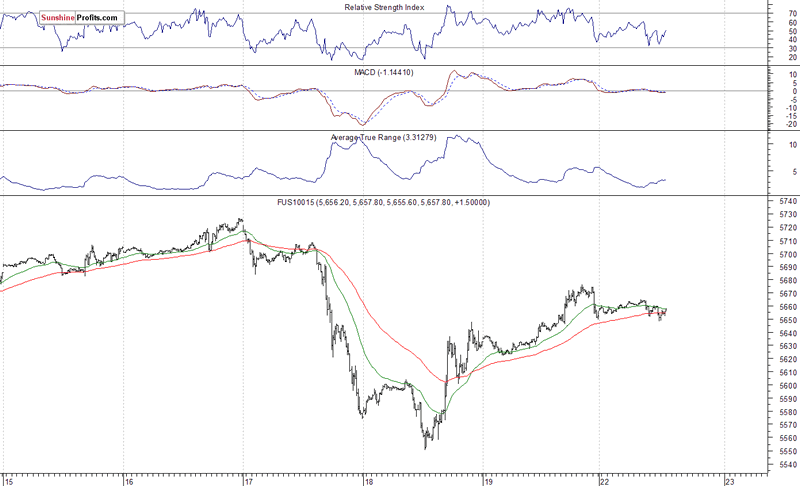
The technology Nasdaq 100 futures contract follows a similar path, as it currently trades within a consolidation along the level of 5.650-5,670. It has retraced its few-week-long rally to new record highs above the level of 5,700 on Wednesday. Then, it bounced off support level at around 5,550. The nearest important level of support is at around 5,.650, and the next support level is at 5,600-5,620, marked by some recent fluctuations. On the other hand, resistance level is 5,670, and the next level of resistance is at 5,700, as the 15-minute chart shows:
Concluding, the S&P 500 index continued its Thursday's rebound on Friday, as investors' sentiment improved. The broad stock market retraced most of its Wednesday's sell-off. Will it continue towards new record highs? Or is this just an upward correction? There have been no confirmed positive signals so far. We still can see medium-term negative technical divergences. Therefore, we continue to maintain our speculative short position (opened on February 15 at 2,335.58 - opening price of the S&P 500 index). Stop-loss level is at 2,410 and potential profit target is at 2,200 (S&P 500 index). You can trade S&P 500 index using futures contracts (S&P 500 futures contract - SP, E-mini S&P 500 futures contract - ES) or an ETF like the SPDR S&P 500 ETF - SPY. It is always important to set some exit price level in case some events cause the price to move in the unlikely direction. Having safety measures in place helps limit potential losses while letting the gains grow.
To summarize: short position in S&P 500 index is justified from the risk/reward perspective with the following entry prices, stop-loss orders and profit target price levels:
S&P 500 index - short position: profit target level: 2,200; stop-loss level: 2,410
S&P 500 futures contract (June) - short position: profit target level: 2,197; stop-loss level: 2,407
SPY ETF (SPDR S&P 500, not leveraged) - short position: profit target level: $220; stop-loss level: $241
SDS ETF (ProShares UltraShort S&P500, leveraged: -2x) - long position: profit target level: $15.47; stop-loss level: $12.98
If you enjoyed reading our analysis, we encourage you to stay up-to-date with our free articles and read them before other investors - sign up to our free gold mailing list today and you'll also get free week of access to our top gold and silver stock rankings, free premium alerts, and investment tools.
Thank you.
Sincerely,
Przemyslaw Radomski, CFA
Founder, Editor-in-chief
Tools for Effective Gold & Silver Investments - SunshineProfits.com
Tools für Effektives Gold- und Silber-Investment - SunshineProfits.DE
* * * * *
About Sunshine Profits
Sunshine Profits enables anyone to forecast market changes with a level of accuracy that was once only available to closed-door institutions. It provides free trial access to its best investment tools (including lists of best gold stocks and best silver stocks), proprietary gold & silver indicators, buy & sell signals, weekly newsletter, and more. Seeing is believing.
Disclaimer
All essays, research and information found above represent analyses and opinions of Przemyslaw Radomski, CFA and Sunshine Profits' associates only. As such, it may prove wrong and be a subject to change without notice. Opinions and analyses were based on data available to authors of respective essays at the time of writing. Although the information provided above is based on careful research and sources that are believed to be accurate, Przemyslaw Radomski, CFA and his associates do not guarantee the accuracy or thoroughness of the data or information reported. The opinions published above are neither an offer nor a recommendation to purchase or sell any securities. Mr. Radomski is not a Registered Securities Advisor. By reading Przemyslaw Radomski's, CFA reports you fully agree that he will not be held responsible or liable for any decisions you make regarding any information provided in these reports. Investing, trading and speculation in any financial markets may involve high risk of loss. Przemyslaw Radomski, CFA, Sunshine Profits' employees and affiliates as well as members of their families may have a short or long position in any securities, including those mentioned in any of the reports or essays, and may make additional purchases and/or sales of those securities without notice.
Przemyslaw Radomski Archive |
© 2005-2022 http://www.MarketOracle.co.uk - The Market Oracle is a FREE Daily Financial Markets Analysis & Forecasting online publication.