


Will North Korea Situation Create a Nifty Stock Market Correction?
Stock-Markets / Stock Market 2017 Aug 15, 2017 - 01:51 AM GMT

 The situation in North Korea went to another level last week when President Trump made some “Fire and Fury” comment. His response to the provocation by North Korea resulted in risk off with sell off across the market, higher VIX, Yen strength. Precious metals such as Gold and Silver also saw bids and started to rally in the back of the news. But did Indices really sell off because of President’s Trump remark as the business news and social media make it to be?
What’s interesting is that this is not the first time that the verbal exchange between North Korea and U.S. government happens. In the past, North Korea has also tested missiles several times and yet nothing happened with the market. So why now after Trump’s remark of “Fire and Fury”, suddenly the news media think this is the reason for the selloff? In reality, the market was already in the position to sell off before Trump’s remark. A close look at the Elliott Wave technical charts suggest the sequences and targets within the cycles in Indices and Yen pairs already warn us the impending selloff.
Many traders and so called experts try to relate the news and the tension created as the cause of the move, but the reality is otherwise. Market always shows a mysterious and impeccable timing when it reaches important area where sequences and cycles could end. Some news typically come out when cycles and sequences are over and those news are being used to justify the turn and create the backdrop story that people love to hear.
We at Elliottwave-Forecast who believe in technical trading always wonder why the news event always comes at the right moment when market is either ready for the move or it is showing sequences for the next move. We are always a bit suspicious about this coincident and in Live sessions, we tell members not to follow news events. We believe a better way is to follow the technical sequences, cycles and the Elliott wave patterns which speak louder than any news event or comments around the world.
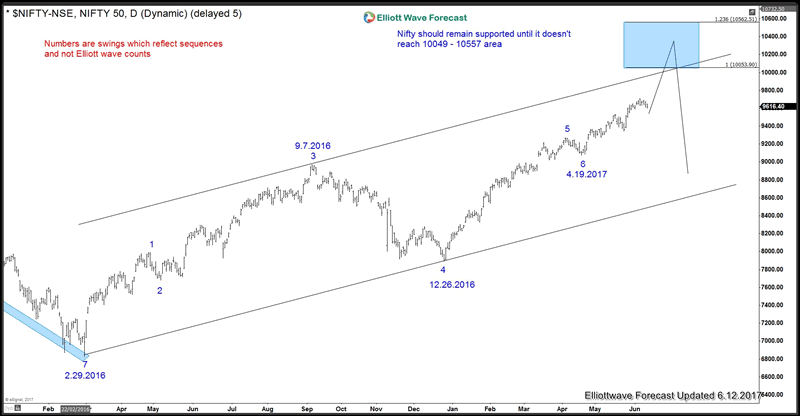
In June 12th 2017, we published an article titled NIFTY-NSE: Next Warning Area for the Bulls. In the article, we showed the target of the $NIFTY-NSE, and we use this target as a possible end of the February 2016 low cycle across the World Indexes. At that time, the Nifty Index was showing a clear structure and lagging other Indices across the World. We said in the article that when NIFTY reaches 10053 area, the World Indices were ready for a 4 Hour pullback and this will represent a good sell off .
We also predict that this pullback will create another hysteria across Investors and World news outlets, and predictably everyone will be calling for another crash. We knew this before it happens, and like we always said the key for all investor is to anticipate the move, not to react to a news event. The June 12th, 2017 chart below shows Nifty was about to reach the blue box at that time and we forecasted it to turn lower. This is the exact area where Nifty and other world indices turned lower last week.
NIFTY Elliott Wave Chart in June 12th Looking for 10049 – 10557 target then a turn
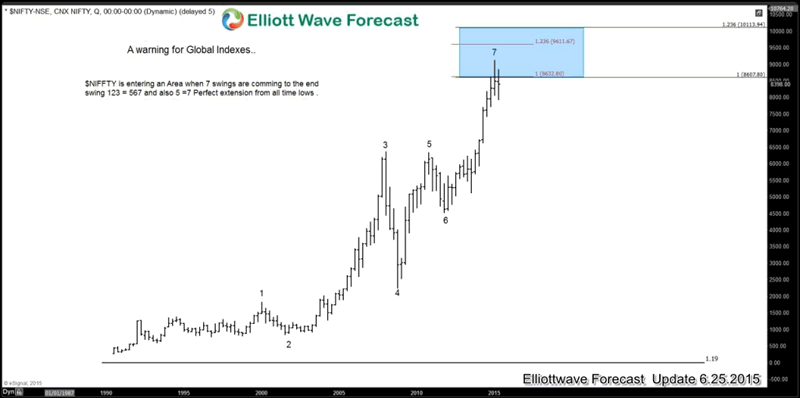
This goes to show the complete anticipation of the turn and manipulation of the Market. In 2015 , we did another article titled $NIFTY reaching a warning area for the bulls. In this article, we also used the $NIFTY-NSE as a tool to spot the turn and we were also right. Why? Because we understand the sequence and cycle of the market. We can calculate the target and we know the market does not run in a straight line. The following chart shows the sequence of $NIFTY entering the 2015. It is showing a 7 swing sequence and has already reached the blue box (inflection area), so we knew either way the Index needs to pullback.
NIFTY Quarterly Chart in 2015 reaching inflection area and looking for pullback
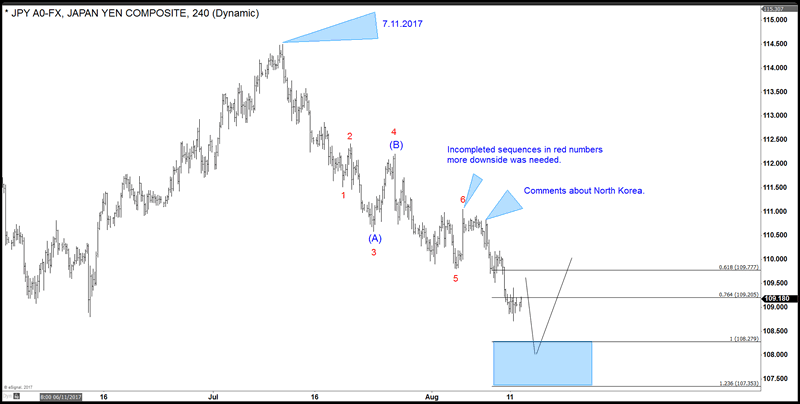
We mentioned earlier how YEN was supposed to get strong regardless of the news and the following chart of $USDJPY is showing the sequence and the YEN strength entering into last week news about North Korea.
USDJPY 4 Hour Elliott Wave Chart looking for more downside before North Korea news
It’s interesting to see that event and news happen when the market either has the minimum number of swings or has reached the target areas. Our years of analysis and trading lead us to believe that the market is completely manipulated and market makers use the events and news to justify the move. Technical trading is superior to news trading as it allow us to anticipate a market turn and quantify the risk.
We have been able to help investors to buy dips in the World Indices in the past years because we believe in sequence, cycle and targets. We advise every trader not to use news event and world situations as the basis of trading. Instead, traders need to understand the reality that the market is running in cycles and sequences and looking for specific target. The news events are part of the oscillations, but do not make the market.
If you enjoy this article and want to learn how to trade these pairs or other instrument, try our service 14 days FREE to get access to Elliott Wave Charts for 52 instrument in 4 time frames, Live Session, Live Trading Room, 24 Hour chat room, and a lot more.
By Ayoub Ben Rejeb
https://elliottwave-forecast.com
ElliottWave-Forecast has built its reputation on accurate technical analysis and a winning attitude. By successfully incorporating the Elliott Wave Theory with Market Correlation, Cycles, Proprietary Pivot System, we provide precise forecasts with up-to-date analysis for 52 instruments including Forex majors & crosses, Commodities and a number of Equity Indices from around the World. Our clients also have immediate access to our proprietary Actionable Trade Setups, Market Overview, 1 Hour, 4 Hour, Daily & Weekly Wave Counts. Weekend Webinar, Live Screen Sharing Sessions, Daily Technical Videos, Elliott Wave Setup .
Copyright © 2017 ElliottWave-Forecast - All Rights Reserved Disclaimer: The above is a matter of opinion provided for general information purposes only and is not intended as investment advice. Information and analysis above are derived from sources and utilising methods believed to be reliable, but we cannot accept responsibility for any losses you may incur as a result of this analysis. Individuals should consult with their personal financial advisors.
© 2005-2022 http://www.MarketOracle.co.uk - The Market Oracle is a FREE Daily Financial Markets Analysis & Forecasting online publication.