


The Global Rise of Chinese Corporate Giants
Companies / China Stocks Nov 27, 2017 - 05:32 AM GMTBy: Dan_Steinbock

 Only a decade ago, Chinese companies accounted for barely 1 percent of the world’s largest companies and multinationals. Today, their share has grown by more than tenfold.
After mid-November, Alibaba again won the highest ecommerce sales day in history on China’s Singles’ Day beating last year’s record by almost 40 percent – hitting some $25.4 billion.
In the United States, the 2016 combined Black Friday and Cyber Monday sales amounted to $6.5 billion, while Amazon’s 2017 Prime Day sales rose to $600 million to $1 billion range. Even combined, all of these revenues account for less than one-third of Alibaba’s Singles’ Day sales.
In one decade, Chinese companies have captured a significant chunk of global competition, thanks to Chinese infrastructure development, savings, rising middle-class – and increasingly global sales.
Corporate behemoths in history
The British multinationals were at the peak of their power in 1914, when they controlled half of the world’s stock of outward foreign direct investment (FDI).
After World War II, US multinationals were positioned to take advantage of post-war reconstruction, transfer of new technologies, and leverage of management capabilities. Their power peaked in the late 1960s, when they dominated half of the world FDI. Coming from a large and integrated economy, the rise of U.S. multinationals – from General Electric and Procter & Gamble to Intel – was often driven by internationalization, based on technological and managerial innovations.
After postwar reconstruction, European multinationals resurfaced. Coming from a continent of diverse economies, their expansion was driven by responsive national strategies, from Unilever to Philips and Ericsson. By the 1960s, British, French and German multinationals began to challenge U.S. multinationals in some sectors.
Starting in the late 1960s,Japanese challengers began to capture increasing market share from cars to consumer electronics, across industries. They benefited from falling trade barriers, improved transport and communications, and increasingly homogeneous markets.
Coming from a unified island-nation, Japanese multinationals – from Matsushita and Toyota to Sony – excelled in global scale efficiencies. The peak of their power occurred in 1990, when they controlled about a tenth of the stock of foreign investment worldwide.
The rise of Chinese multinationals
Since the 1980s, globalization has contributed to the rise of large emerging economies. Unlike corporate giants from advanced economies, aspiring Chinese companies have had to cope with competition that is increasingly global, capital-intensive, and innovative.
From Haier and Lenovo to Huawei and Tencent – not to speak about the Chinese giants in banking and insurance, construction, utility, automotive, oil and engineering – the pioneering Chinese corporate behemoths often benefit from cost advantages that are beyond the reach of their current rivals.
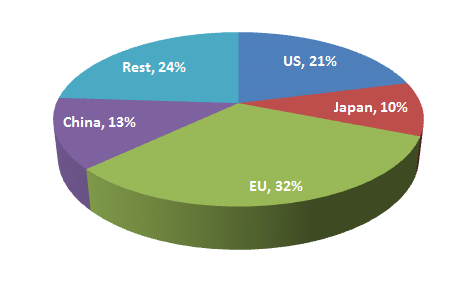
Before the global crisis, advanced economies – US (16%), Europe (49%) and Japan (4%) – accounted for more than two-thirds of all outward foreign direct investment (FDI) worldwide. In contrast, China’s share was barely 1 percent.
Today, advanced economies – US (21%), EU (32%), Japan (10%) - continue to dominate almost two thirds of total outward FDI. However, the share of China has grown more than tenfold to 13 percent of the total. That’s a dramatic increase in just a decade (Figure 1)
Figure 1 Global 500, 2015
Source: Data from FT Global 500
The rise of Chinese corporate giants
The same goes for the rankings of the world’s largest companies, as measured by market value.
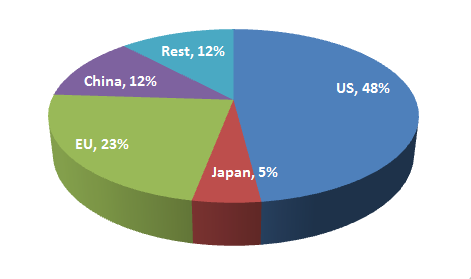
At the eve of the global financial crisis, advanced economies – US (16%), EU (49%) and Japan (4%) – still dominated more than two thirds of the market value of the world’s 500 leading corporations. In contrast, the share of Chinese companies was barely 1 percent.
Barely half a decade after the global crisis and the European credit crisis, advanced economies – US (21%), EU (32%), Japan (10%) – still had almost two-thirds of the total. However, the share of Chinese companies had soared more than ten-fold (11%) (Figure2).
This, however, is just the beginning. As global R&D hubs broaden in China and the role of the mainland’s multinationals spreads worldwide, Chinese companies will begin to compete for global leadership – while paving way for the rise of other corporate giants from large emerging economies.
Figure 2 Outward FDI Flows, 2016
Source: UNCTAD
Dr Steinbock is the founder of the Difference Group and has served as the research director at the India, China, and America Institute (USA) and a visiting fellow at the Shanghai Institutes for International Studies (China) and the EU Center (Singapore). For more information, see http://www.differencegroup.net/
© 2017 Copyright Dan Steinbock - All Rights Reserved
Disclaimer: The above is a matter of opinion provided for general information purposes only and is not intended as investment advice. Information and analysis above are derived from sources and utilising methods believed to be reliable, but we cannot accept responsibility for any losses you may incur as a result of this analysis. Individuals should consult with their personal financial advisors.
© 2005-2022 http://www.MarketOracle.co.uk - The Market Oracle is a FREE Daily Financial Markets Analysis & Forecasting online publication.