


Watch These S&P Numbers For Clues…
Stock-Markets / Stock Markets 2018 Apr 17, 2018 - 11:57 AM GMTBy: Harry_Dent

 On Tuesday, Rodney talked to his Triple Play Strategy subscribers about the extreme volatility we’re experiencing in the markets. He asked the question: “So, how are you feeling?” as he observed that investors are looking increasingly tired from the extreme drops and bounces we’ve endured the least few weeks. He concluded that the situation isn’t looking good and he’s admittedly turned bearish.
I may be with Rodney on that.
Never mind that the economy and debt and financial asset bubbles need to deflate if we’re ever to grow again. Right now, the bears are putting up a fight for dominance. But the short-term fluctuations seem to be favoring the upside a bit for now.
I wrote to our Boom & Bust subscribers on March 12, showing them the two scenarios we could see in the stock market before the inevitable greatest crash of our lifetimes. And last Wednesday I sent you a midday market update.
Well, we keep testing the bottom trend-lines of the final “orgasmic” rally, but have yet to see anything more than a few minor, brief breaches. Like Rodney said yesterday, it’s exhausting.
In my mind, those breaches suggest we could see a strong break to the downside. It could even get as bad or as violent as the sudden 1987 crash. If that happens, as my research suggests, the first drop could be at least 30%… and may even extend to 50%… in a matter of months.
The big question on everyone’s mind is: when?
In the last 12 trading days, stocks have been up or down as much as 500 to 700 points on the Dow (something that happened just before the sudden two-week crash in the Dow in 1987!).
And yes, the stock market is way overvalued due to Quantitative Easing and zero-interest-rate policies since early 2009, so it won’t take much to upturn the apple cart (ahem… trade war with China… or disappointing job and economic growth numbers ahead, despite projections to the upside…)
Yet, as I said earlier, the indicators seem to be favoring a break up, not down.
Since everyone is confused, I keep looking at chart patterns. Most other indicators have been rendered useless thanks to central banks taking over the free-market system with endless QE and now tax cuts from the fiscal side.
Look at this chart.
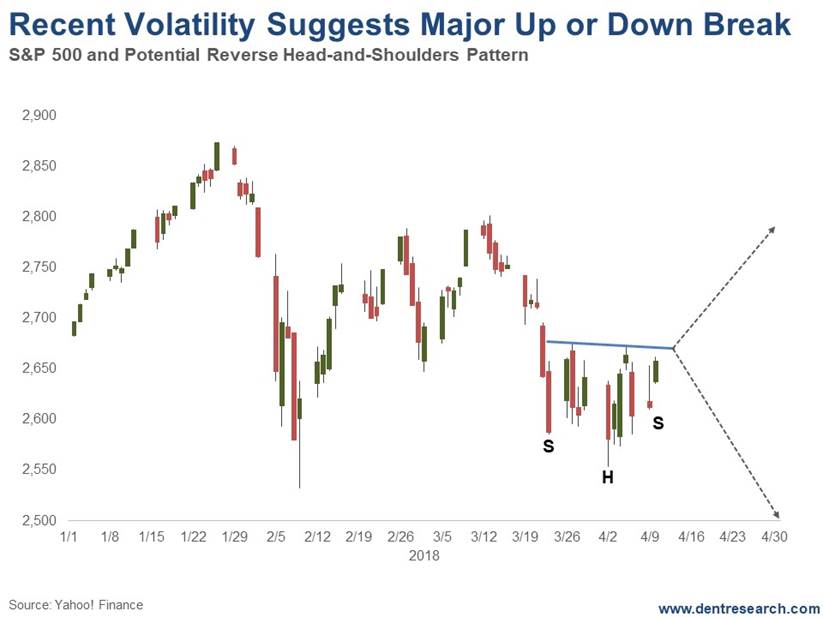
This chart shows a small, but classic reverse head-and-shoulders pattern, that suggests if the market breaks convincingly enough above 2,670 on the S&P 500 we could see a bullish move with some momentum.
But we need to break to new highs, or at least above 2,800, for the bullish case to still be in play, especially after the violent crash from late January into February.
That said, a failure to break just above Tuesday’s highs of 2,662, to say 2,670-plus, would be a bearish sign.
Exhausting!
The number to watch here is 2,670 give or take a bit on the S&P 500.
Possibly most important of all is to make sure you stick to your chosen strategy, be that Cycle 9 Alert, 10X Profits, Triple Play Strategy, Peak Income, Hidden Profits, or Treasury Profits Accelerator. Adam, Rodney, Charles, John, and Lance have their finger on the pulse, yes. But they are ardent believers in escape plans and are ready to not only help their subscribers escape major harm from any crash, but also to be positioned to grab profits in either direction.
Speaking of Charles, he has an interesting chart to share with you below…
Harry
Follow me on Twitter @HarryDentjr
Harry studied economics in college in the ’70s, but found it vague and inconclusive. He became so disillusioned by the state of the profession that he turned his back on it. Instead, he threw himself into the burgeoning New Science of Finance, which married economic research and market research and encompassed identifying and studying demographic trends, business cycles, consumers’ purchasing power and many, many other trends that empowered him to forecast economic and market changes.
Copyright © 2018 Harry Dent- All Rights Reserved Disclaimer: The above is a matter of opinion provided for general information purposes only and is not intended as investment advice. Information and analysis above are derived from sources and utilising methods believed to be reliable, but we cannot accept responsibility for any losses you may incur as a result of this analysis. Individuals should consult with their personal financial advisors.
© 2005-2022 http://www.MarketOracle.co.uk - The Market Oracle is a FREE Daily Financial Markets Analysis & Forecasting online publication.