


VIX Cycles Point to Stock Market Correction
Stock-Markets / Stock Markets 2018 May 17, 2018 - 03:20 AM GMTBy: Chris_Vermeulen

 Recently, we authored an article about Fibonacci price levels in which we referred to a term called “Fibonacci Price Ladders”. This is our own term, as far as we know, and we used it as a way to attempt to explain how price operates within the Fibonacci theory. Our objective was to allow the reader to think of a standard ladder and how each ladder rung allows the climber to advance (move up) or decline (move down) using the ladder. We hope it helped all of our readers to better understand the concept of how price rotates within a trend to establish longer-term price trends.
Within this post, we are going to revisit this Fibonacci Price Ladder concept to show you how recent price rotation may be setting up for a new, and possibly historical, price advance in the near future. We urge our readers to revisit our earlier Fibonacci Price Ladder research to refresh your memory should you have any questions about this research.
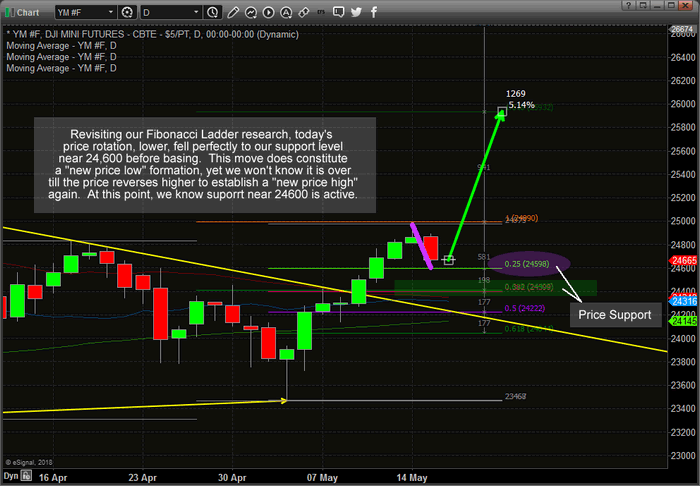
Daily DOW Index Chart
This Daily YM Mini DOW Index chart shows the price rotation, downward, that moved directly to our Fibonacci support level near 24,600. Technically, this constitutes a “new price low” formation and could foretell the end of this price correction before a new price advance begins. If you remember, our prior analysis has indicated a very strong potential for a very strong price move higher from recent lows. Yes, we expected this move and actually protected ourselves and our members by pulling profits in some trades near the highs last week. Now that this move appears to be nearing completion with a proper Fibonacci price rotation, we believe a new price bottom will form quickly near the 24,600 level (with massive support existing above 24,400) driving a new price advance within days.
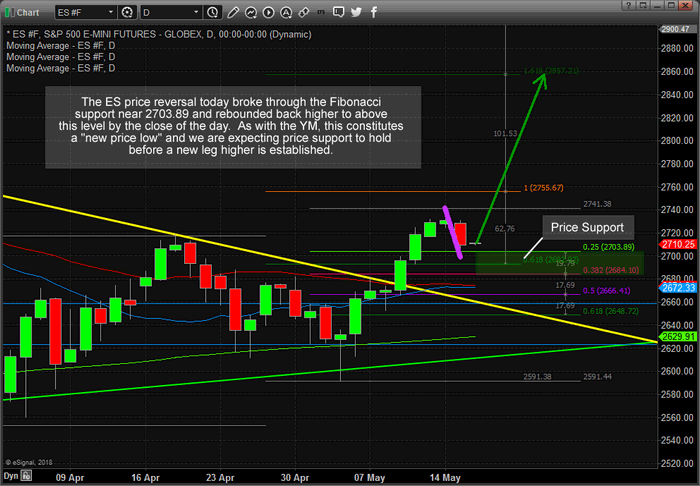
Daily ES Chart
This Daily ES chart helps to confirm the Fibonacci Price Ladder analysis by showing an even deeper “new price low” price rotation recently forming. Massive price support exists in the ES between 2684 and 2700 and we believe this level will hold to form a price bottom/base before a new leg higher will advance price to new highs.
This Fibonacci Ladder process is simple to understand, once a new price high or low is established, any failure to continue to set new immediate higher highs or lower lows constitutes a potential failure of the current price trend. So, if this recent low price move is a move to near a market base/bottom, then we should expect an upside price rotation to set up fairly quickly over the next few days. We believe this will be the case and that traders should already be looking for new entry levels for the next leg higher.
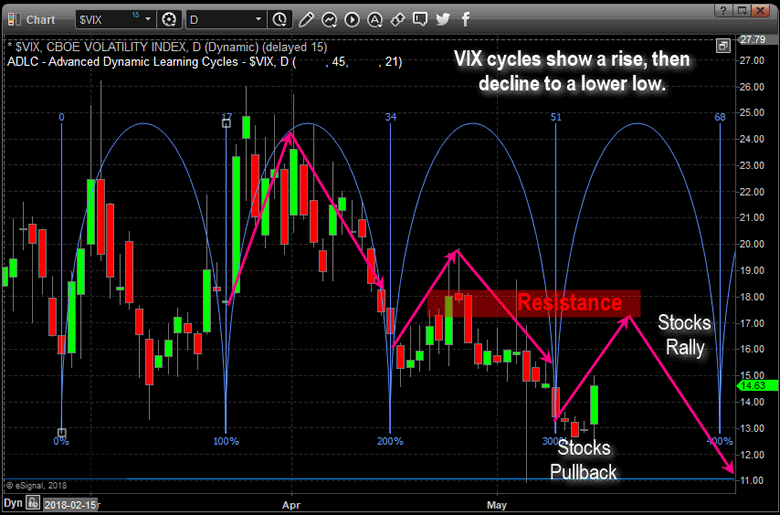
Daily VIX Chart
This last Daily VIX chart showing Fibonacci Time/Price cycles shows that we are nearing a major cycle date, with resistance just above the current price of the vix. We should expect the current downside stock market price to possibly extend downward, briefly, to establish a low price rotation and then reverse higher to begin a new upside price leg.
It is our belief that the VIX will stall near the resistance level and fall back to near or below $11 as the new upside price advance in the US majors extends to near all-time highs.
Currently, we see this price rotation as a healthy normal price rotation that is essential to a further price advance. Price MUST attempt to rotate while establishing new price lows in order to establish new price highs. This is healthy, normal price rotation that we believe will result in a larger price advance in the immediate future.
We are already searching for new entry triggers to take advantage of the future price leg higher. If you are searching for ways to profit from this, and other future price moves, then visit www.TheTechnicalTraders.com to learn how we can help with Daily video content, extensive and proprietary research and price modeling, detailed trade triggers and analysis and more. Our job is to assist you in becoming a better and more successful trader.
53 years experience in researching and trading makes analyzing the complex and ever-changing financial markets a natural process. We have a simple and highly effective way to provide our customers with the most convenient, accurate, and timely market forecasts available today. Our stock and ETF trading alerts are readily available through our exclusive membership service via email and SMS text. Our newsletter, Technical Trading Mastery book, and 3 Hour Trading Video Course are designed for both traders and investors. Also, some of our strategies have been fully automated for the ultimate trading experience.
Chris Vermeulen
www.TheTechnicalTraders.com
Chris Vermeulen has been involved in the markets since 1997 and is the founder of Technical Traders Ltd. He is an internationally recognized technical analyst, trader, and is the author of the book: 7 Steps to Win With Logic
Through years of research, trading and helping individual traders around the world. He learned that many traders have great trading ideas, but they lack one thing, they struggle to execute trades in a systematic way for consistent results. Chris helps educate traders with a three-hour video course that can change your trading results for the better.
His mission is to help his clients boost their trading performance while reducing market exposure and portfolio volatility.
He is a regular speaker on HoweStreet.com, and the FinancialSurvivorNetwork radio shows. Chris was also featured on the cover of AmalgaTrader Magazine, and contributes articles to several leading financial hubs like MarketOracle.co.uk
Disclaimer: Nothing in this report should be construed as a solicitation to buy or sell any securities mentioned. Technical Traders Ltd., its owners and the author of this report are not registered broker-dealers or financial advisors. Before investing in any securities, you should consult with your financial advisor and a registered broker-dealer. Never make an investment based solely on what you read in an online or printed report, including this report, especially if the investment involves a small, thinly-traded company that isn’t well known. Technical Traders Ltd. and the author of this report has been paid by Cardiff Energy Corp. In addition, the author owns shares of Cardiff Energy Corp. and would also benefit from volume and price appreciation of its stock. The information provided here within should not be construed as a financial analysis but rather as an advertisement. The author’s views and opinions regarding the companies featured in reports are his own views and are based on information that he has researched independently and has received, which the author assumes to be reliable. Technical Traders Ltd. and the author of this report do not guarantee the accuracy, completeness, or usefulness of any content of this report, nor its fitness for any particular purpose. Lastly, the author does not guarantee that any of the companies mentioned in the reports will perform as expected, and any comparisons made to other companies may not be valid or come into effect.
Chris Vermeulen Archive |
© 2005-2022 http://www.MarketOracle.co.uk - The Market Oracle is a FREE Daily Financial Markets Analysis & Forecasting online publication.