


Are the Stock Market Bulls Starting to Run?
Stock-Markets / Stock Markets 2018 Jul 09, 2018 - 06:19 AM GMTBy: Andre_Gratian

 Current Position of the Market
SPX: Long-term trend – The bull market is continuing with a top expected in the low 3000s.
Intermediate trend – In spite of recent market action, the intermediate trend from 2873 have to extendits corrective phase.
Analysis of the short-term trend is done on a daily basis with the help of hourly charts. It is an important adjunct to the analysis of daily and weekly charts which discusses the course of longer market trends.
Daily market analysis of the short term trend is reserved for subscribers. If you would like to sign up for a FREE 4-week trial period of daily comments, please let me know at ajg@cybertrails.com
Are the Bulls Starting to Run?
Market Overview
On Friday, traders were faced with a decision: should they respond to the news of the continued trade war or should they acknowledge the strong jobs number which had just been reported? They chose the latter and took the market up for a twenty-point ride past the 2740 resistance with profit-taking beginning to appear only after reaching 2760. 2740 had pushed prices back twice before, but this time the index went through with little hesitation proving once again that “the third time is the charm”.
So, what does this mean? Have we started a significant uptrend, or is this another head fake? The amount of congestion which formed below 2740 gives us two valid projections: one which targets the level where we stopped on Friday, and the other which extends to about 2800. At least this much seems to be in the cards.
There is a good chance that Friday’s high will turn out to be a near-term top. The two minor cycles which appear to be behind the short-term market rhythm are scheduled to make their lows on Tuesday and Wednesday, so a two or three-day consolidation early in the week would be normal; and if we do not have undue weakness during this time period, we could continue the rally toward the 2800 projection afterwards. But getting past that level may turn out to be problematic for reasons that I will discuss a little later. Let’s see how next week goes, and we’ll take it from there.
Chart analysis (The charts that are shown below are courtesy of QCharts)
SPX daily chart
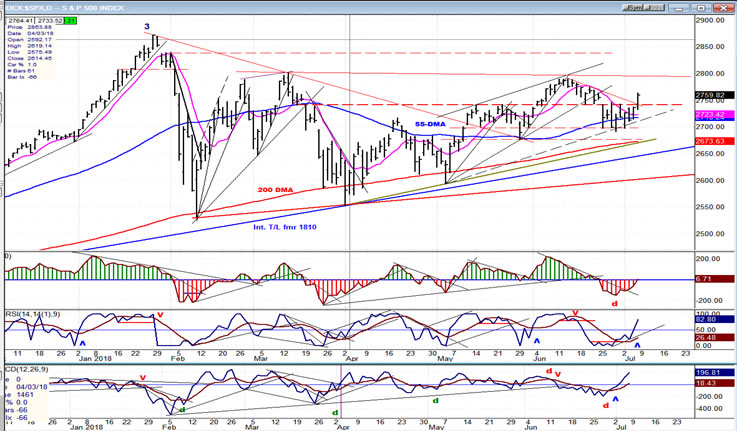
The daily chart has a longer term bullish appearance. Ever since the early February low, the correction has progressed through a series of higher lows, mostly revolving around the level of the 200-DMA. Therefore, the question is not whether most of the weakness is behind us, but rather have we concluded the 4th wave structure and, even if we have, are we ready for new highs right away? Friday’s action certainly looks like a break-out and, judging by the price action alone, this move looks ready to extend higher.
However, an analysis of the P&F chart suggest that this rally has a maximum count of about 2800. So, what happens after we get there is still an unknown and, instead of a mere consolidation followed by an extension of the rally, more weakness than we currently anticipate could return. This is what the oscillators may be suggesting!
The two lower ones are normal for the price action, but we also know from previous study that they are the early birds which at times tend to be impatient and therefore not as reliable as the top one. Besides the fact that the CCI has only moved to neutral and not given a confirmed buy signal, the previous weakness in this indicator resulted in negative divergence which was not neutralized by clear positive divergence at the current low. That could lead to more negative divergence as we go higher, indicating that the rally is coming to an end.
But beyond this oscillator pattern, there are more important concerns with the market action that I will address a little later.
SPX hourly chart
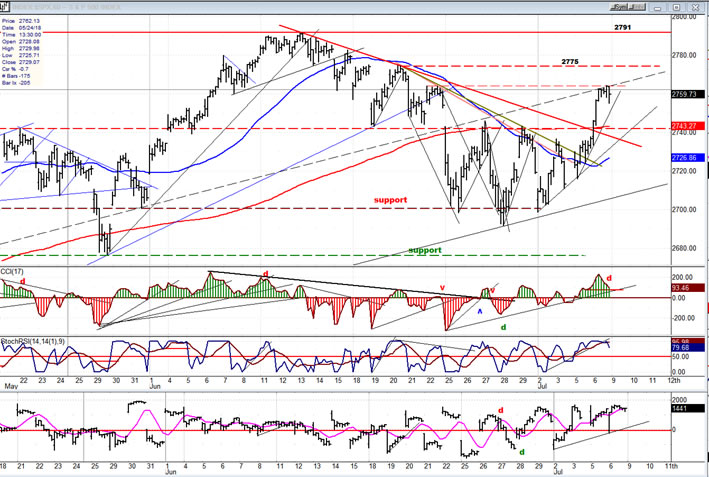
(A glitch in the data provider program left a one day gap for the 4th holiday, so trend lines spanning that gap will not be one hundred percent reliable, but they should still be valuable.)
On the 5th, SPX closed outside of the secondary (green) trend line, and the next day it overcame resistance at 2740 and moved through the primary (red) trend line. Breadth was supportive, and this has to be considered bullish short-term action. The rally faltered at minor resistance created by a former high, and this is reflected in the action of the oscillators which are warning of a minor top. This probability is enhanced by the fact that our two minor cycles are expected to make their lows on Tuesday and Wednesday. This should create a consolidation followed by an attempt at extending the uptrend toward the end of the week.
The pull-back early next week should not extend beyond 2740, although there could be a back-test of the broken (red) downtrend line. This would be an acceptable correction of the current uptrend. What happens next will determine whether we have really started a significant move which will challenge the previous high, or if it fizzles at 2800 or lower. I mentioned earlier that there are two valid projections: the first to the current level, and the next to about 2800. So, we have good data to evaluate the rally’s potential.
In the next two sections, we’ll see why this move may not be as bullish as it appears.
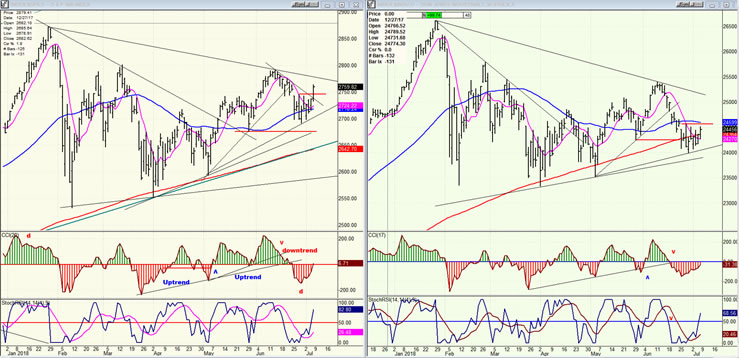
SPX vs DJIA (daily charts)
The contrast between these two charts is significant! The DJIA (right) is far weaker than SPX. Moreover, this is something fairly recent. Until late June, the two indexes were pretty much moving together with perhaps a hint of a lag in the DJIA. But since then, the relative weakness of the latter increased, materially, right up to Friday! This cannot be good for the market as a whole, and it would take a lot of catching up on the part of the Dow to get the trend back on an even par.
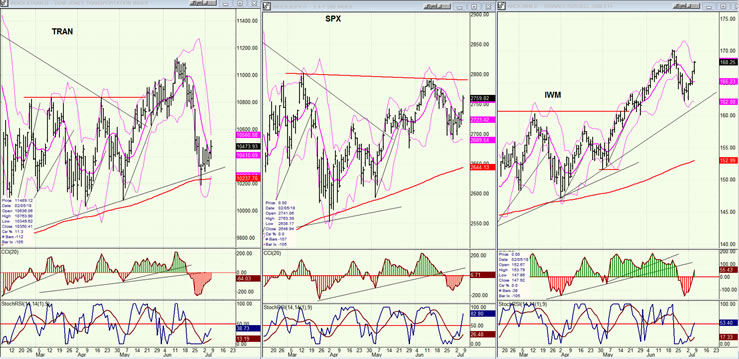
TRAN, SPX, IWM (daily)
The relative weakness of the TRAN to SPX is also a concern. And if SPX goes to 2800 with IWM failing to make a new high, it will be even more worrisome for the bulls. Even if they both make a new highs simultaneously, enough warning signs have already accumulated that one cannot get super bullish until these discrepancies have been normalized!
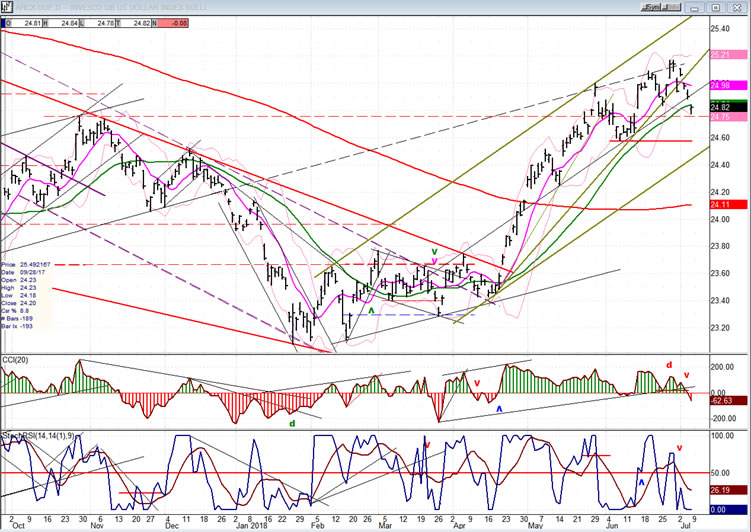
UUP (dollar ETF) Weekly
UUP has begun to correct! Nothing severe is forecast yet, but both oscillators have now turned negative and this could mean more weakness directly ahead. However, the price would have to fall below the red horizontal line and move out of the channel to suggest that a serious reversal has taken place.
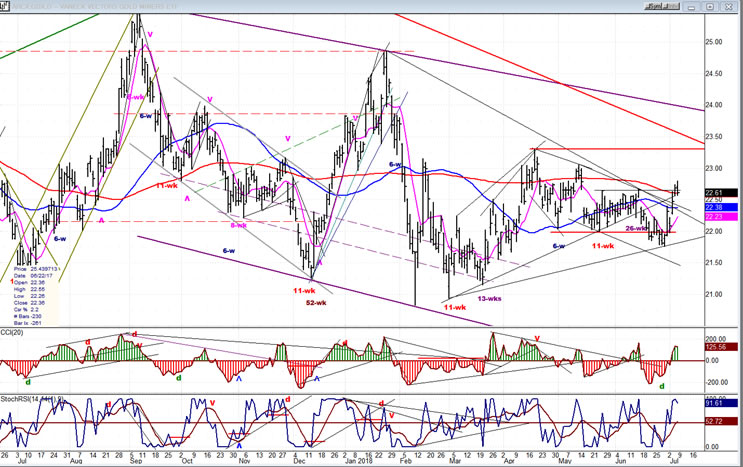
GDX (Gold miners ETF)
GDX has benefited from the weakness in UUP. This is the first attempt that it has made to successfully overcome its former short-term peaks. Since the index has reached its 200-DMA, it may require a little consolidation before a resurgence of buying with the horizontal red line above as the next target. This would also require a more sustained correction in UUP.
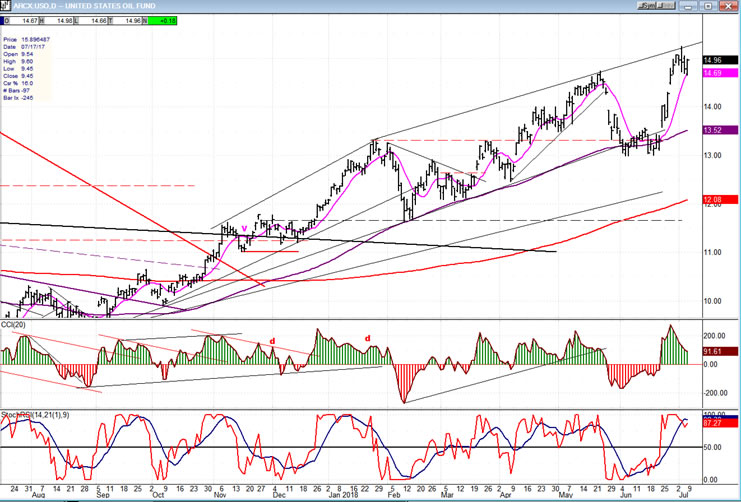
USO (United States Oil Fund)
USO held the bottom of its channel and stayed above the 89-DMA before rising to a new high and remaining within the confines of its initial projection target. It would have to move out of the channel top to suggest that the uptrend is accelerating. This is not anticipated right away; rather, a more sustained period of correction is likely.
Summary
SPX benefited from strength in NDX and broke back above its 2740 resistance. Since this move is not supported by equal strength in DJIA and TRAN, one should not get too bullish unless this move can be sustained with a solid move above 2800 and a resurgence of strength in the DOW complex.
Andre
For a FREE 4-week trial, send an email to anvi1962@cableone.net, or go to www.marketurningpoints.com and click on "subscribe". There, you will also find subscription options, payment plans, weekly newsletters, and general information. By clicking on "Free Newsletter" you can get a preview of the latest newsletter which is normally posted on Sunday afternoon (unless it happens to be a 3-day weekend, in which case it could be posted on Monday).
Disclaimer - The above comments about the financial markets are based purely on what I consider to be sound technical analysis principles uncompromised by fundamental considerations. They represent my own opinion and are not meant to be construed as trading or investment advice, but are offered as an analytical point of view which might be of interest to those who follow stock market cycles and technical analysis.
Andre Gratian Archive |
© 2005-2022 http://www.MarketOracle.co.uk - The Market Oracle is a FREE Daily Financial Markets Analysis & Forecasting online publication.