


Stock Market Dow Analysis
Stock-Markets / Stock Markets 2018 Aug 13, 2018 - 07:11 AM GMTBy: Austin_Galt

 Latest Price – 25313
Previous analysis updated – price as traded as outlined in analysis produced in June.
Pattern – we can see price has rallied nicely in July and I expect some further upside ahead. This is all part of the consolidation that I believe is still in motion. There is a full moon on the 26th August so that is some potential timing for a high. If not, the new moon on the 9th September is another potential timing target. Given the human body is composed of around 60% water and the moon affects the tides, then it should not come as a surprise that the moon is related to the stock market as the chart is just a picture of human behaviour. Just ask any hospital surgeon who will confirm that a surge in patients always occurs on a full moon and that same type of euphoria that causes revellers to hurt themselves on a high can be said of stock market players.
Daily Chart
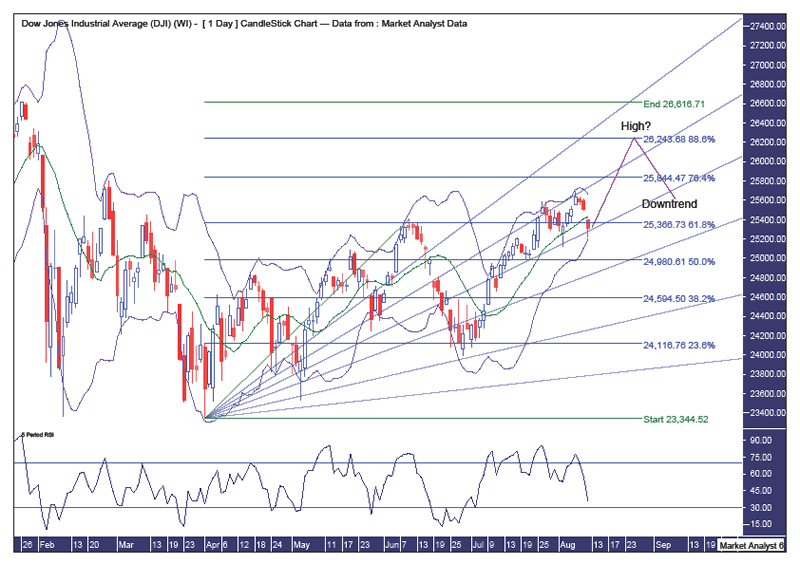
Bollinger Bands - price has come back to the lower band and I expect support to come in here and send price back up.
Fibonacci – price is back at the 50% angle which I expect to provide support. Ultimately, I am targeting price to turn back down around the 88.6% Fibonacci retracement level of 26243.
RSI – weak although has had a good run down. Perhaps time to turn back up??
Monthly Chart
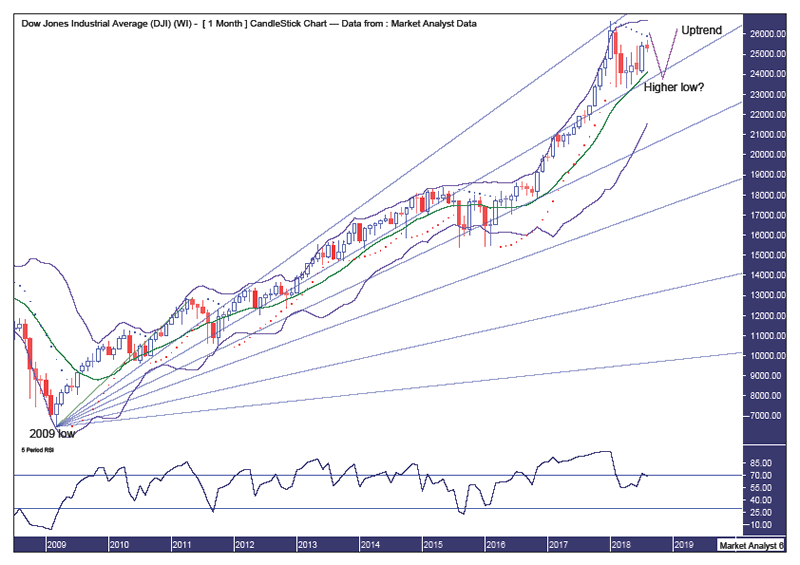
Pattern – we can see this consolidation is really just a blip within a massive uptrend.
Bollinger Bands – I am looking for another test of support from the middle band should price turn back down as laid out.
PSAR – the dots are currently at 25907 and as outlined in previous analysis I expect price to crack this resistance before turning back down and then testing the dots on the downside which will then act as support.
Fibonacci – should price turn back down as expected then the 38.2% angle should provide support and see in the higher low.
RSI – nudging overbought territory and I expect this indicator to get more solidly into oversold territory before price turns back down.
Summing up - I believe price has a bit more upside left before turning back down and testing the April 2018 low of 23344.
By Austin Galt
Austin Galt has previously worked as a stockbroker and investment banker while studying technical analysis for over two decades. He is also the author of the book White Night: A Colombian Odyssey
Email - info@thevoodooanalyst.com
© 2018 Copyright The Voodoo Analyst - All Rights Reserved
Disclaimer: The above is a matter of opinion provided for general information purposes only and is not intended as investment advice. Information and analysis above are derived from sources and utilising methods believed to be reliable, but we cannot accept responsibility for any losses you may incur as a result of this analysis. Individuals should consult with their personal financial advisors.
Austin Galt Archive |
© 2005-2022 http://www.MarketOracle.co.uk - The Market Oracle is a FREE Daily Financial Markets Analysis & Forecasting online publication.