


Stock Market Sharp Corrections and Bounces are Usually Followed by Retests
Stock-Markets / Stock Markets 2018 Nov 05, 2018 - 01:26 PM GMTBy: Troy_Bombardia

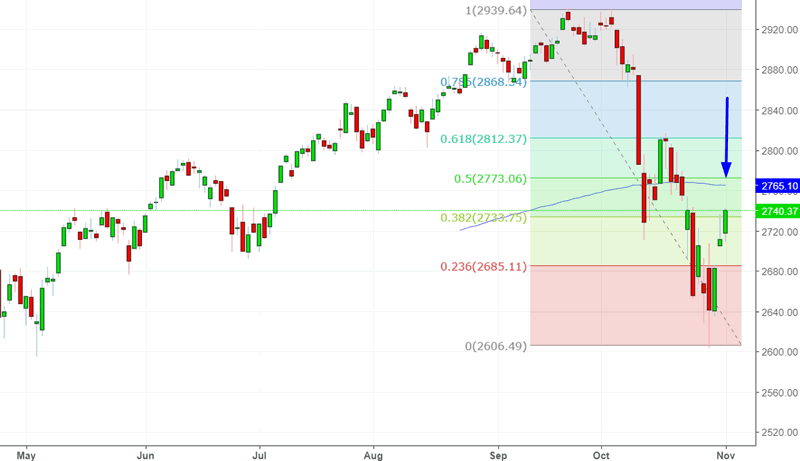
After a rapid drop last month, the U.S. stock market has bounced over the past 3 days. The S&P’s most likely target for this bounce is its 200 day moving average.
Let’s analyze the stock market’s price action by objectively quantifying technical analysis. For the sake of reference, here’s the random probability of the U.S. stock market going up on any given day, week, or month.

*Probability ≠ certainty.
Very strong bounces usually see a retest before trending higher
Very strong post-correction rallies usually see a 50-61.8% retracement bounce, a retest, and then an uptrend. This is how the January 2018 correction played out.
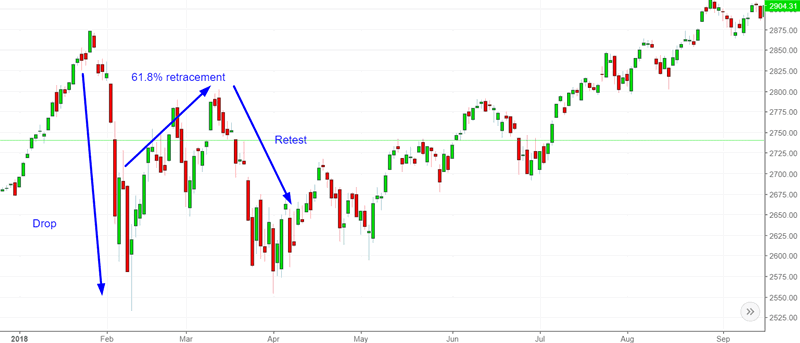
That is the most probable case for this correction as well.
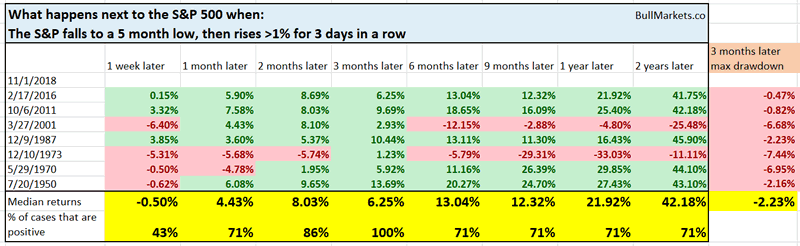
For starters, the S&P 500 has rallied more than 1% for 3 days in a row after falling to a 5 month low.
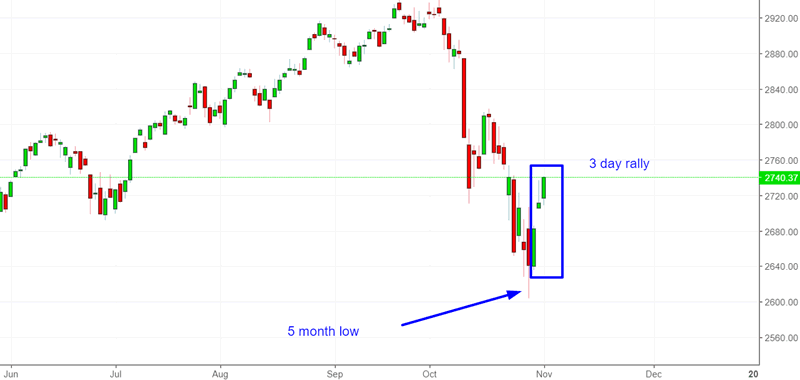
Here’s what happened next to the S&P 500 when it rallied more than 1% for 3 days in a row after falling to a 5 month low.
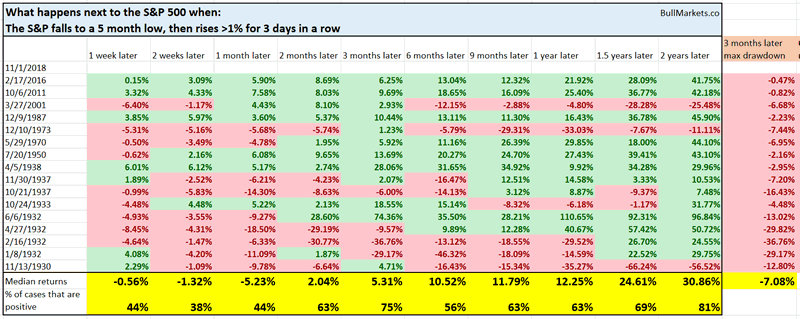
As you can see, the S&P tends to fall in the next 2 weeks. However, many of these historical cases occurred in 1932 – 1933, AFTER the stock market had already crashed 50%+ and the economy was in a depression. So this doesn’t account for context.
Here’s what the same chart looks like if we only look at the cases after 1950:
The sample size is smaller, but overall, the U.S. stock market tends to rally over the next 3 months, even if it does face short term weakness.
Another way of looking at this sharp rally
Here’s another way of looking at this sharp bounce.
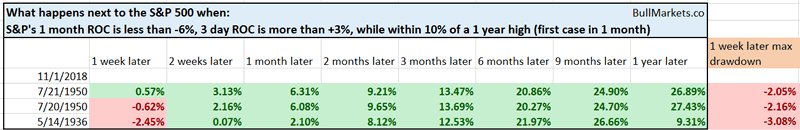
The S&P 500’s 1 month rate-of-change is less than -6%, while it’s 3 day rate-of-change is more than +3%.
Such a sharp drop and sharp bounce is rare when the S&P is less than -10% below its 1 year high.
Here are the historical cases from 1927 present.
Let’s expand the sample sizes.
Here’s what happened next to the S&P 500 when its 1 month rate-of-change was less than -5%, its 3 day rate-of-change was more than +3%, while it was within -10% of a 1 year high.
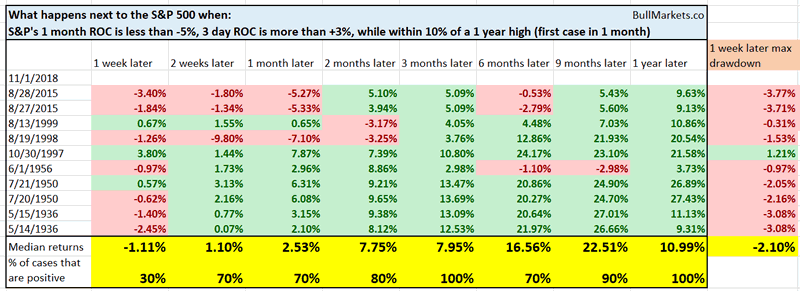
As you can see, the S&P tends to face short term weakness over the next 1 week, while it tends to go up 3 months later.
Let’s expand the sample sizes even more.
Here’s what happened next to the S&P 500 when its 1 month rate-of-change was less than -5%, its 3 day rate-of-change was more than +3%, while it was within -20% of a 1 year high.
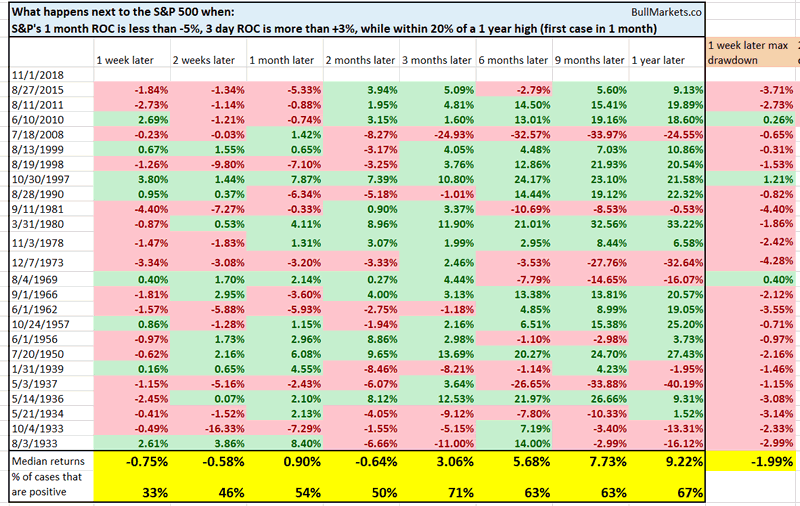
Once again, the S&P tends to fall over the next 1 week.
All the buying has occurred during the night
Here’s a very interesting observation.
This chart demonstrates what happens in 2018 if you:
- Buy and hold only during regular trading hours (i.e. buy at 9:30 am and sell at 4 pm each day), vs….
- Buy and hold only during after-hours trading (i.e. buy at 4 pm and sell the next day at 9:30 am).
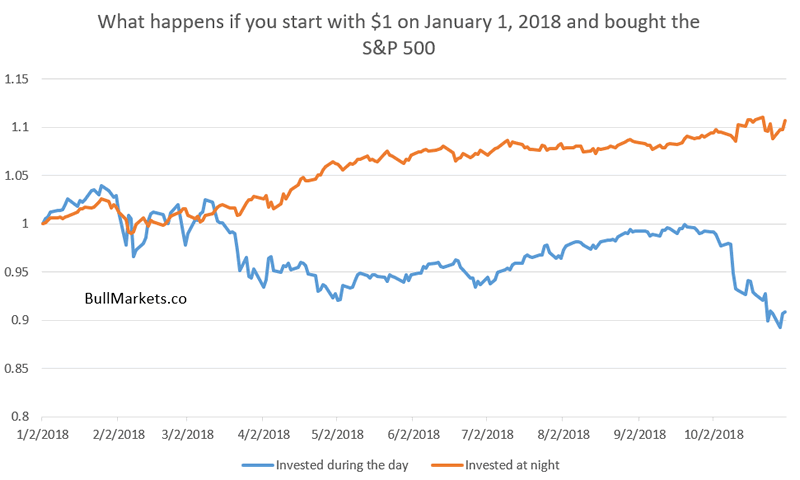
As you can see, almost all of the S&P 500’s gains this year have come from after-hours trading.
From 1962 – present, this kind of divergence is unprecedented. There has never been another historical case in which over the past 11 months, the S&P during the day has gone down more than -10% while the S&P at night has gone up more than +10%.
The closest such divergence occurred on January 12, 1972, when the S&P during the night had gone up +3% while the S&P during the day had gone down -3% over the past 11 months. As you know, the U.S. stock market began a bear market 1 year later in January 1973
As I said, this kind of divergence is unheard of.
Some traders see this as a bearish sign, i.e. “some is ramping up” the market on after-hours low volume while the majority sell their stocks during regular hours trading.
I don’t think it’s that simple. No single force is big enough to manipulate the market that way. Most claims of “manipulation” end up being nothing more than conspiracy theories.
Anyways, just some food for thought. I don’t think this is bearish or bullish. These days overnight trading is more important than ever. That’s why big “gap ups” and “gap downs” are increasingly common. Globalisation has resulted in trillions of dollars of non-U.S. money flooding into U.S. markets.
A completely irrelevant factor
In the next few weeks the S&P 500 will most likely make a “death cross”, whereby its 50 daily moving average crosses below its 200 daily moving average.
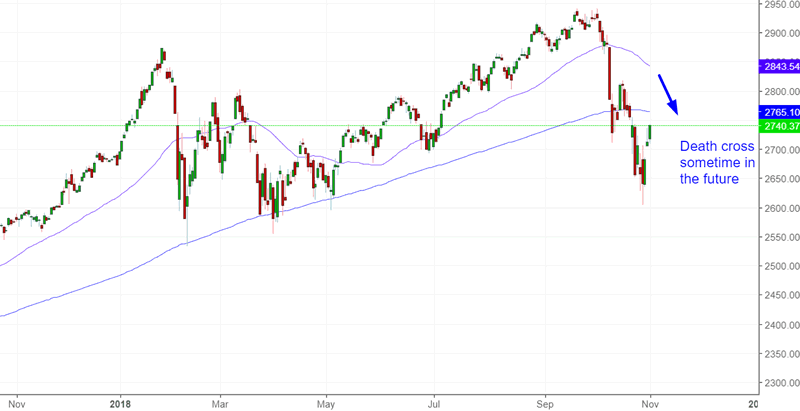
When that happens, you can be sure that mainstream financial media will trip over themselves screaming “HOLY SHIT THE STOCK MARKET MADE A DEATH CROSS. THE WORLD IS ENDING!!!!!”
But factually speaking, “death crosses” are no better than a coin toss at predicting the market. Every single bear market had a death cross, but most death crosses don’t result in bear markets.
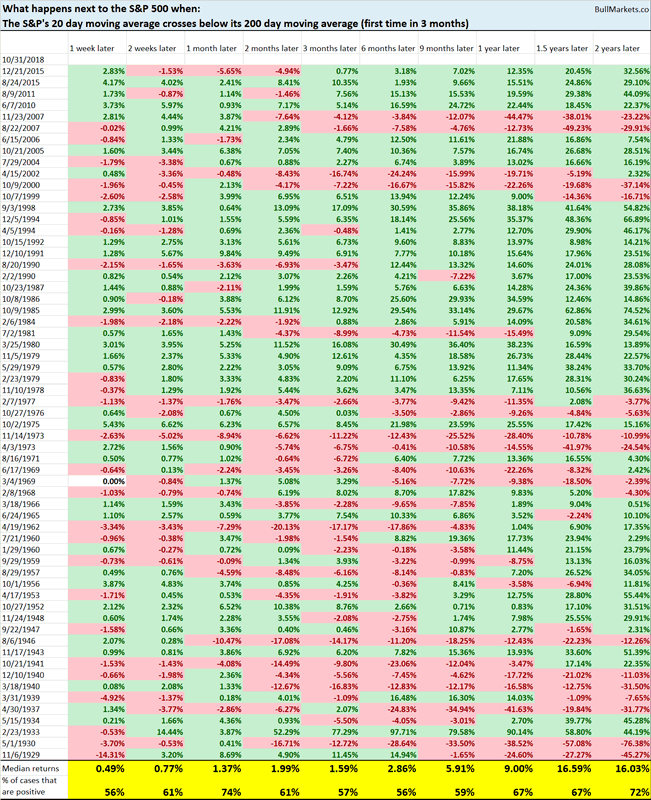
The S&P 500 has made a smaller “death cross” recently. It’s 20 day moving average has fallen below its 200 day moving average.
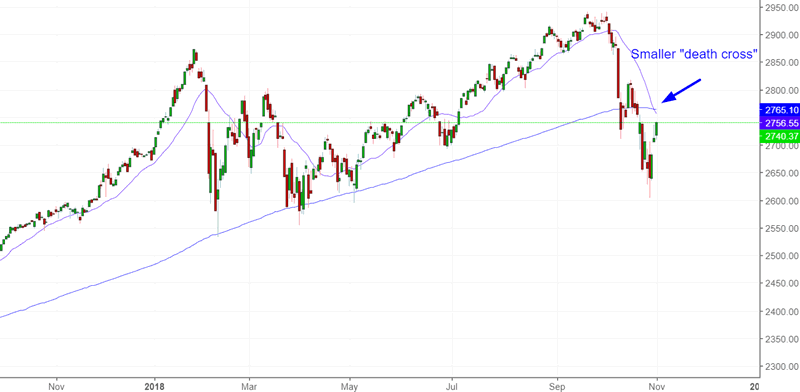
This kind of “death cross” is neither consistently bullish nor bearish for the U.S. stock market on any time frame. It is no better than a coin toss.
Click here to see yesterday’s market study
Conclusion
Our discretionary technical outlook remains the same:
- The current bull market will peak sometime in Q2 2019.
- The medium term remains bullish (i.e. trend for the next 6-9 months). Volatility is extremely high right now. Since volatility is mean-reverting and moves in the opposite direction of the stock market, this is medium term bullish.
- The short term is slightly bearish. There’s a slightly >50% chance that the S&P will retest its lows from last week. This probability isn’t exceptionally high, so I wouldn’t bank on it.
- When the stock market’s short term is unclear (as it is most of the time), focus on the medium term. Step back and look at the big picture. Don’t lose yourself in a sea of noise.
Our discretionary outlook is usually, but not always, a reflection of how we’re trading the markets right now. We trade based on our clear, quantitative trading models, such as the Medium-Long Term Model.
Members can see exactly how we’re trading the U.S. stock market right now based on our trading models.
Click here for more market studies
By Troy Bombardia
I’m Troy Bombardia, the author behind BullMarkets.co. I used to run a hedge fund, but closed it due to a major health scare. I am now enjoying life and simply investing/trading my own account. I focus on long term performance and ignore short term performance.
Copyright 2018 © Troy Bombardia - All Rights Reserved
Disclaimer: The above is a matter of opinion provided for general information purposes only and is not intended as investment advice. Information and analysis above are derived from sources and utilising methods believed to be reliable, but we cannot accept responsibility for any losses you may incur as a result of this analysis. Individuals should consult with their personal financial advisors.
© 2005-2022 http://www.MarketOracle.co.uk - The Market Oracle is a FREE Daily Financial Markets Analysis & Forecasting online publication.