


Warning: Precious Metals’ Gold and Silver Prices are about to Collapse!
Commodities / Gold and Silver 2018 Nov 13, 2018 - 03:25 PM GMTBy: P_Radomski_CFA

 Silver just moved to its 2018 bottom. Not somewhat above it, not relatively close to it – silver’s Friday’s close of $14.14 equals the previous lowest closing price of 2018 that was formed on September 14th. That’s not yet a breakdown, but the implications are severe.
Silver’s Move to the 2018 Bottom
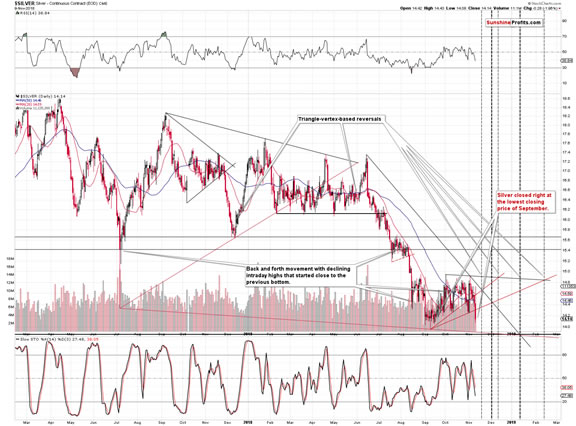
Silver’s decline means breakdowns (on big volume) below the October lows and the rising red support line.
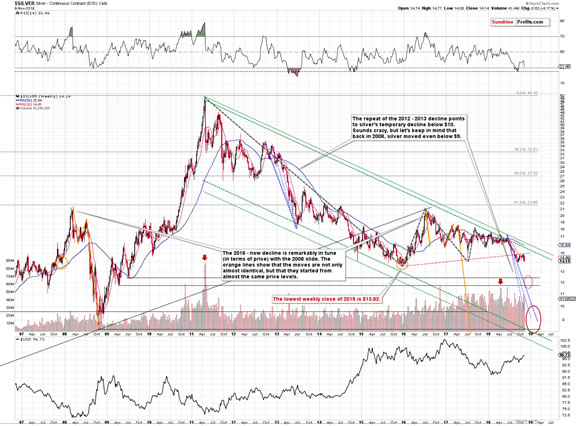
From the long-term point of view, silver seems to have already completed the post-breakdown correction and has now started its next move lower. The moves that preceded the consolidation tend to be repeated after the consolidation is completed and this means that silver is soon likely to break below its 2015 bottom.
This will be a shocking event to those, who were calling the bottom in gold earlier this year. This shock might – and is quite likely to – turn into panic and sharp selling as investors want to limit their losses. The support that is relatively far below the 2015 low and at the same time approximately corresponds to the size of the preceding decline is the area around the $12 level. That’s where we have two 2009 bottoms. None of them is extremely important, but they are the only ones that we have between the 2015 bottom and the 2008 bottom, so they are quite likely to provide temporary support.
Another reason why Friday’s move is so important is the situation in the gold to silver ratio.
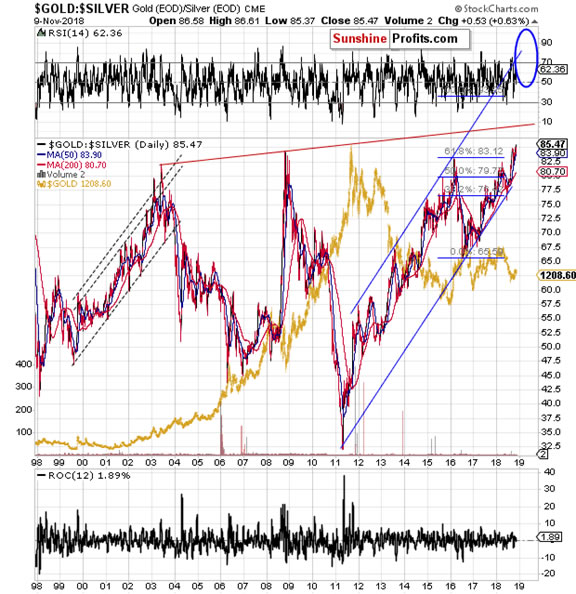
With a weekly close above 85, it’s clear that the ratio broke above the previous long-term highs. The next long-term target is the rising red line that’s approximately at the 90 level and the final one is at about 100. Interestingly, with gold at about $1,050 and the ratio at 90, we get $11.67 as the silver price prediction, which is very close to the April 2009 low (the lower one), which is $11.72. The above further validates the interim price target area (around $12) for the white metal.
The full version of today’s analysis includes the details and forecasts for the gold market, and while we’ll keep them exclusive for our subscribers, we would like to tell you about the critical signal that we saw in the gold stocks. It’s about something much more important than the short-term head-and-shoulders patterns.
Gold Stocks’ Critical Indication
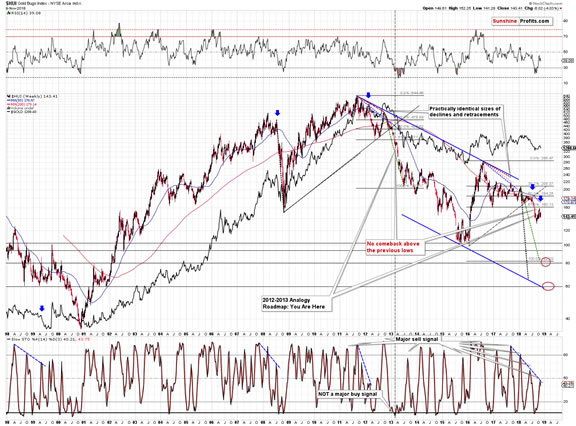
Namely, we just saw a sell signal from the weekly Stochastic indicator. This is a big deal, because this indicator confirmed major tops and preceded big price declines many times in the recent past. The signal has been particularly useful since 2011.
The other interesting thing is that we saw lower highs in the past several months and this is characteristic only for the biggest of the declines. We saw this kind of performance of the weekly Stochastic indicator in 1999, in 2008, and in 2012. The last two were obviously excellent times to exit the precious metals market, but the first one appears to be different.
And it was different, but not because of the regular factors. It was the Washington Agreement on Gold that caused gold to spike in 1999, taking the rest of the PM market with it. If it wasn’t for this spike, we would have likely seen a bottom in gold quite similar to what we saw in the gold stocks, and gold’s Brown bottom would have formed even lower. The gold miners declined in a profound manner right after the spike. Consequently, if it wasn’t for the Washington Agreement, the precious metals sector would have most likely declined in a rather regular manner after the above-mentioned series of signals from the weekly Stochastic indicator.
Therefore, it seems justified to say that all 3 previous cases that are similar to what we see right now, have been followed by the biggest declines of the past 20 years. The implications of this analogy and of the sell signal from the weekly Stochastic indicator are extremely bearish.
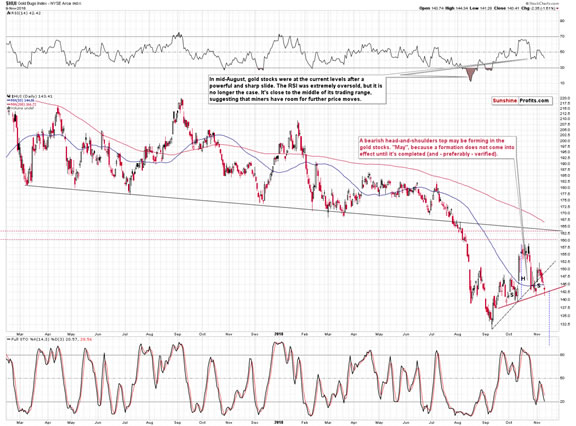
From the short-term point of view, we see that the mining stocks moved visibly lower but that they haven’t completed the bearish head-and-shoulders formation just yet. Therefore, there are no implications of this formation just yet, but based on the signals that we discussed previously today, it seems that the breakdown below the neck level is just around the corner and thus that the short-term outlook will become very bearish shortly.
To be clear, it’s already bearish at this time and the latest confirmation of the outlook comes from the confirmation of the breakdown below the rising dashed support line. The HUI Index moved visibly below it and closed below it for three consecutive trading days.
We recently wrote a lot about the incomplete inverse head-and-shoulders pattern in gold and we made some of those comments available publicly. But, to be honest, we don’t expect our analysis to change minds of either gold promoters or analysts that don’t pay attention to details.
Vision vs. Facts
In his book Thinking, Fast and Slow, the Nobel-prize laureate, Daniel Kahneman is explaining that when people have to choose between the vision that they have for something that is based on (what they view as) coherent signals, and between obvious facts that contradict their vision, they will choose the initial vision and ignore the facts. This effect is stronger if the vision is clearer and signals appear more coherent. A very short way to put it would be to say “my mind’s made up; don’t confuse me with facts”.
In case of the precious metals market, you have multiple sources that will want to confirm the bullish outlook for gold simply because they can either sell their gold and silver to you, or they can sell their analyses. The bias of the former seems self-explanatory, but the latter requires an explanation.
They – the other analysts – know that, because we know that, and they have access to the same statistics. The point is that on average, investors and traders don’t want to hear that something is going to decline, especially if they have invested in it, or want to invest in it. This means that they will want to buy the analyses that are bullish, and they will be reluctant to buy the analyses that dare to be bearish. And they will not want to purchase anything that is bearish on average. We know that based on the reactions to various types of analyses, ads, e-mail titles etc. we create.
The above means that analysts know that they are being rewarded for being bullish and are being punished for being bearish. What does that lead to? We reviewed the free precious metals analyses that are available and almost all of them are bullish. And this is despite the huge number of bearish factors that we (alone) presented publicly in the previous weeks. This number exceeds the number of bullish points that are generally being discussed (of course, one cannot count the fundamental reasons as they do not determine market’s direction in the short run and, in many cases, in the medium run). It’s important to note that we discuss the factors that appear bullish at the first sight, explaining and proving why they actually don’t make the outlook bullish, while the bullish camp just ignores the bearish factors, pretending they are not there.
Investors and analysts are being provided with facts and signals and they choose to ignore them. Why? Because their bullish vision is too coherent for them to be willing to accept that it may be incorrect.
Naturally, it would be easy to say the same about our analyses – why are we sticking to the bearish outlook? Is it because of the above-mentioned bias? The difference is that we don’t ignore the signals that are presented as bullish. Conversely, we welcome criticism and are happy to discuss the bullish factors. In fact, we want to test our views against adverse indications. If our initial analysis fails to hold in light of new factors, it’s time to drop it, adjust the outlook and investment / trading positions accordingly, and prepare to benefit from the move that appears most likely based on the most up-to-date analysis.
The objectivity, care, and openness to change is what creates value for investors. Being biased is what destroys value, even if it is disguised as “staying strongly bullish during tough times”.
And us? We’re taking the road much less travelled. The analysis needs to be done as objectively as possible and investors’ real interest has to come first. That’s why we will continue to describe things exactly as we see them, with as much objectivity as possible, utilizing diligence and great care, even if it comes at our own expense.
We admit; that was a rather long digression. The reason that we mentioned the incomplete inverse head-and-shoulders in the first place was that we have an incomplete (!) head-and-shoulders in golds stocks. It doesn’t have any implications yet, but if completed, it will have a target below 130, meaning a clear break to new 2018 lows. The funny thing is that if one wants to view incomplete H&S patterns as meaningful, then the bearish implications are currently even stronger.
Finally, let’s take a look at what happened in the USD Index.
USD’s Bullish Outlook
In Friday’s Gold Trading Alert, we wrote the following:
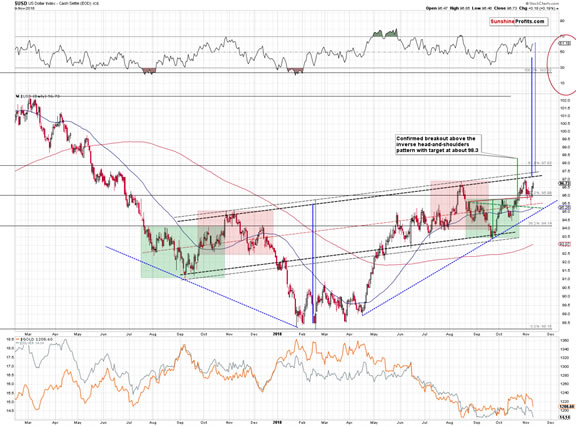
The USD moved higher after a very brief move back to the middle of its rising trading range that we marked with a red dashed line. It’s worth noting, because something similar happened in early August 2017 and since this year’s rally is the reflection of last year’s decline, it could mean that this was the bottom and that higher values of the USD Index will follow. The outlook for the medium term has been bullish for a long time, but this time it finally seems that the multi-month consolidation is over. The implications are very bearish for the precious metals sector.
The above remains up-to-date, but we would like to add one more thing. On October 31st, we wrote that gold’s relative strength to the USD Index is likely coming to an end and that this tendency is likely to be reversed. This is what is taking place right now. The USD Index is close to its mid-August high and gold is not yet close to its mid-August low, but silver is already below its mid-August low. On the short-term basis, the comeback is even clearer as its visible in both precious metals. The USD Index is not yet above its late-October high, but both: gold and silver are below their respective October lows. The implications are very bearish for the precious metals sector, especially that the outlook for the USD Index is bullish.
Summary
Summing up, the outlook remains strongly bearish for the precious metals sector and the new long-term and short-term sell signals confirm it.There is a huge opportunity in taking advantage of the upcoming slide and then taking on big positions close to the final bottom, when others will be too scared to do so.It seems that another big decline in gold, silver and mining stocks has just begun and that the huge profits on our short positions will become enormous shortly.
Naturally, the above is up-to-date at the moment of publishing it and the situation may – and is likely to – change in the future. If you’d like to receive follow-ups to the above analysis (including the intraday ones, when things get hot), we invite you subscribe to our Gold & Silver Trading Alerts today.
Thank you.
Przemyslaw Radomski, CFA
Founder, Editor-in-chief
Tools for Effective Gold & Silver Investments - SunshineProfits.com
Tools für Effektives Gold- und Silber-Investment - SunshineProfits.DE
* * * * *
About Sunshine Profits
Sunshine Profits enables anyone to forecast market changes with a level of accuracy that was once only available to closed-door institutions. It provides free trial access to its best investment tools (including lists of best gold stocks and best silver stocks), proprietary gold & silver indicators, buy & sell signals, weekly newsletter, and more. Seeing is believing.
Disclaimer
All essays, research and information found above represent analyses and opinions of Przemyslaw Radomski, CFA and Sunshine Profits' associates only. As such, it may prove wrong and be a subject to change without notice. Opinions and analyses were based on data available to authors of respective essays at the time of writing. Although the information provided above is based on careful research and sources that are believed to be accurate, Przemyslaw Radomski, CFA and his associates do not guarantee the accuracy or thoroughness of the data or information reported. The opinions published above are neither an offer nor a recommendation to purchase or sell any securities. Mr. Radomski is not a Registered Securities Advisor. By reading Przemyslaw Radomski's, CFA reports you fully agree that he will not be held responsible or liable for any decisions you make regarding any information provided in these reports. Investing, trading and speculation in any financial markets may involve high risk of loss. Przemyslaw Radomski, CFA, Sunshine Profits' employees and affiliates as well as members of their families may have a short or long position in any securities, including those mentioned in any of the reports or essays, and may make additional purchases and/or sales of those securities without notice.
Przemyslaw Radomski Archive |
© 2005-2022 http://www.MarketOracle.co.uk - The Market Oracle is a FREE Daily Financial Markets Analysis & Forecasting online publication.