


Mauldin: My 2019 Economic Outlook
Economics / US Economy Jan 17, 2019 - 04:01 PM GMTBy: John_Mauldin

 I recently did a “2019 Investment Outlook” webinar with my business partner Steve Blumenthal.
We looked at three topics: recession probability, credit conditions, and stock valuations. I can tell, we went deep on the webinar. You can read a transcript or view a recording here.
Here I’ll give you an abbreviated version of that webinar.
Economists Can’t Recognize Recessions in Real Time
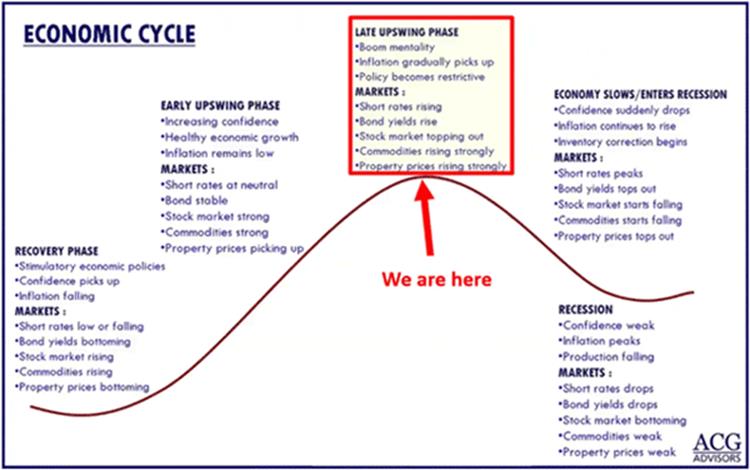
Steve started the webinar by noting we are late in an economic cycle. He showed the chart below to illustrate how all cycles have expansion periods that end with recession.
Source: CMG Capital Management
The longest expansion cycle (1991–2001) lasted 10 years or 120 months. The average since 1854 is 40 months. Then recession, then expansion, then recession.
The 2001 post-recession recovery lasted 80 months and ended with the Great Recession. We are 114 months into the current expansion, the second longest in US history.
Again, a recession is coming. The question is when.
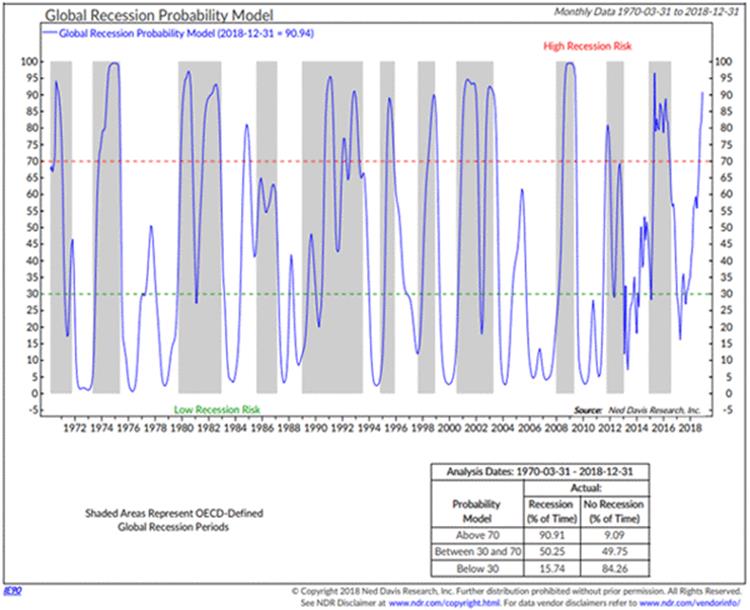
Steve watches an indicator from Ned Davis Research called the Global Recession Probability Model.
Source: CMG Capital Management
This model measures leading indicators across 35 countries. It looks at things like money supply, yield curve, building permits, consumer and business sentiment, share prices, and manufacturing production.
It’s done a good job at calling recessions, shown in the gray bars. Any reading above that red dotted line of 70 is the danger zone. When that’s occurred, over 90% of the time we’ve been in recession.
On the webinar, I pointed out that this useful chart doesn’t just indicate a coming global recession. It says we’re in one.
Economists identify them in hindsight. We only know we’re in a recession when we look back on the past data. So, the gray bars don’t appear in real time. They get added later.
There was a point in 2000 that we were in a recession for just one quarter. It was three years later they tell us this. This illustrates that economists are pretty bad at actually recognizing recessions in real time.
We could find out in late 2019 that a recession began sometime the prior spring.
What Employment Data and the Yield Curve Suggest
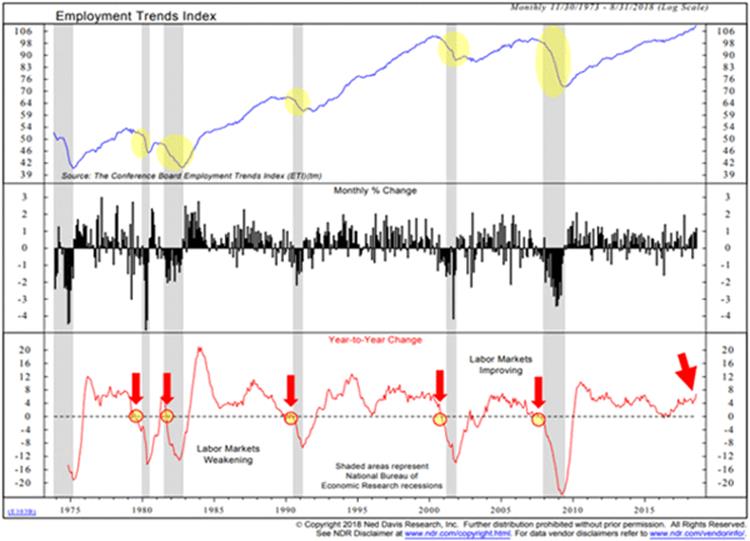
The next chart we went over was the year-to-year rate of change in Employment Trends index. Note how when employment trends have declined, recession (gray bars) followed.
Source: CMG Capital Management
So, recession risk is highest when this index’s yearly change is below zero. Conditions are currently favorable, with low recession risk.
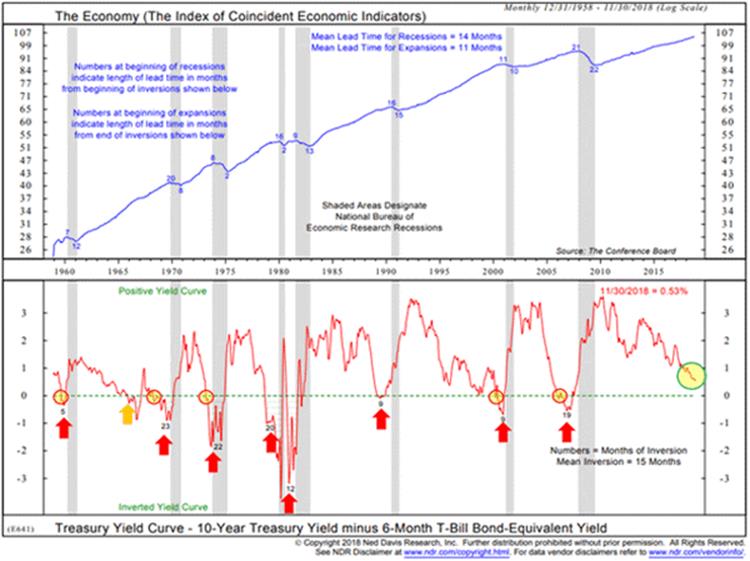
Next, let’s look at the yield curve. I explained last week that it’s flattening but not yet inverted, which would signal recession 9–15 months later.
Source: CMG Capital Management
We’ve highlighted inversion periods in yellow circles. Typically, it’s anywhere from 9 to 15 months between the inversion and the beginning of a recession. Presently we are not there yet.
As you’ll notice, the yield curve nearly always turns positive before we actually go into recession. I know this from my painful experience. I called the last recession after the yield curve inverted and the markets promptly went up 20% more.
As of now, portions of the yield curve are flattening. It looks like the beginning of an inversion. The Fed seems aware of it, too.
Corporate Credit Can Get Out of Control Any Time
But recession isn’t the only risk we face for 2019.
I’ve talked several times this year about corporate debt and it just keeps growing. The corporate bond market is roughly three times bigger than it was in 2008.
Worse, quality is dropping as quantity increases. In 2008, the US had about $3 trillion in corporate bonds outstanding. Now, we have far more than that just in the BBB ratings or below.
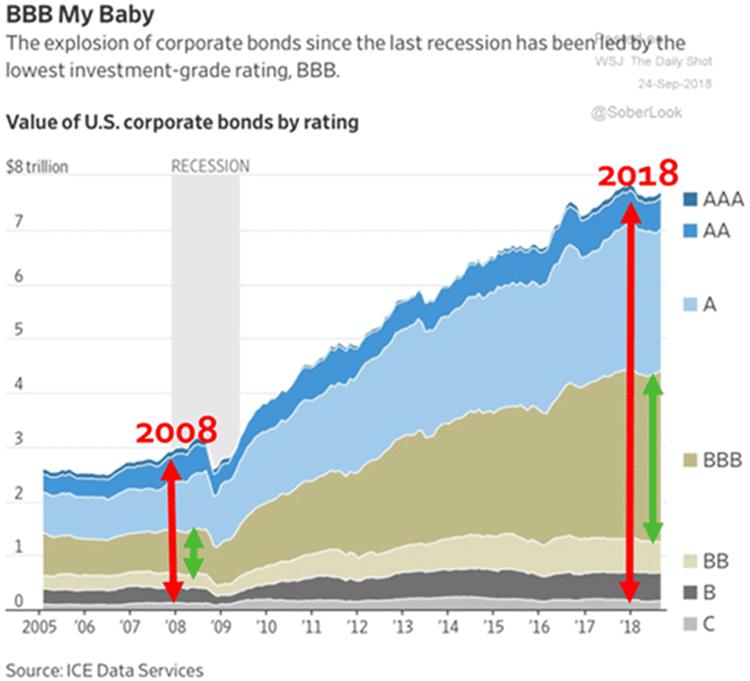
Source: CMG Capital Management
This might be tolerable if corporations had fortress-like balance sheets. Some do, but most don’t.
And yet yield-hungry investors have been throwing money at these companies. They accepted it but don’t necessarily use it wisely. Some large companies live on borrowed money and don’t have the reserves to survive long without it.
The goods news is that these problems are not widespread yet. They won’t necessarily become so in 2019.
Here is another Ned Davis chart.
A dip below the green dotted line signals unfavorable credit conditions that would mean trouble for leveraged companies. As Warren Buffett famously said, that’s when the tide goes out and you see who’s swimming naked.
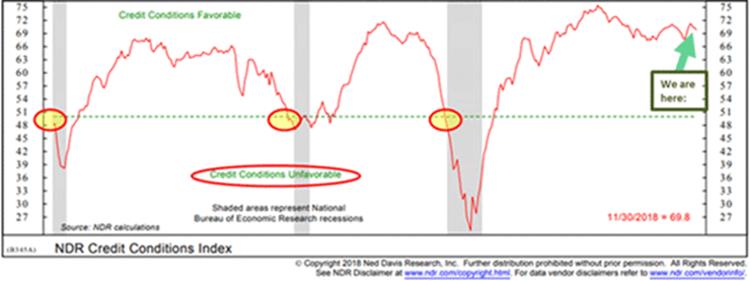
Source: CMG Capital Management
The last three times happened near the beginning of recessions. Presently we are far from that point.
On the other hand, notice how fast the index fell right before the last recession. So, while this looks okay for now, it is important to watch, which I and Steve do.
Stock Valuations Scream “Don’t Buy”
Finally, let’s get to what is most important for investors. Are your stocks safe? The quick answer is stocks are never safe. If safety is the priority, you should probably consider something else.
Stocks are a “risk” asset. The real question is whether the gains adequately pay you for the risk you are taking. The higher the valuation, the less you are being paid.
If you’re long stocks, this next chart will be disturbing to you.
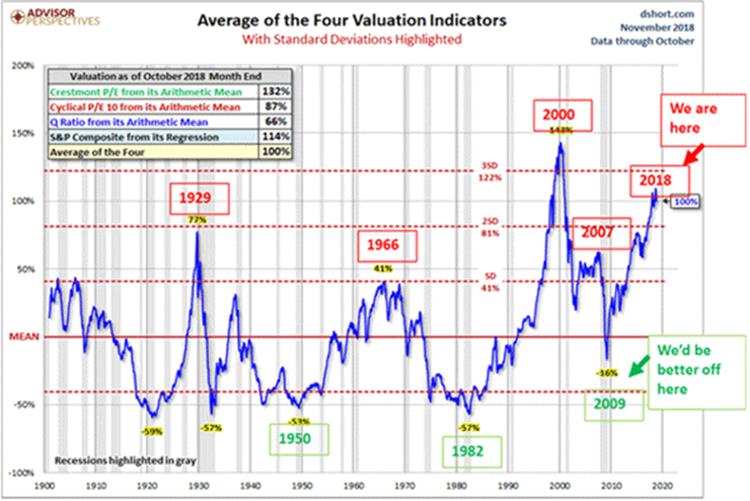
Source: CMG Capital Management
The average of four popular valuations is now at the second-highest point since 1900. The highest was in 2000. We are much higher now than in 2007, which led to a 55% peak-to-trough decline.
That kind of decline won’t necessarily happen next year. But it’s all but certain within ten years.
So this may not be a “sell” signal, but it sure looks like a “don’t buy” signal. And even with the recent drop, I would not “buy the dip.”
Note the bottom section of the chart where it says, “We’d be better off here.”
That’s what a buying opportunity looks like. Buying opportunities happen at the bottom of the cycle when everybody is scared. That’s true for stocks, high yields, real estate, and everything else.
When people say they’re worried about holding cash, I remind them cash is an option on the future. It’s not earning very much right now but could potentially earn a lot more when you buy at the bottom.
I’m not looking at this and panicking at all. I’m rubbing my hands at the coming chance to buy solid assets cheap.
Get one of the world’s most widely read investment newsletters… free
Sharp macroeconomic analysis, big market calls, and shrewd predictions are all in a week’s work for visionary thinker and acclaimed financial expert John Mauldin. Since 2001, investors have turned to his Thoughts from the Frontline to be informed about what’s really going on in the economy. Join hundreds of thousands of readers, and get it free in your inbox every week.
© 2005-2022 http://www.MarketOracle.co.uk - The Market Oracle is a FREE Daily Financial Markets Analysis & Forecasting online publication.