


Dangers Beyond a Trade War with China
Stock-Markets / Financial Markets 2019 May 14, 2019 - 10:06 AM GMTBy: Harry_Dent

 U.S. markets have had a bad week. After reaching all-time highs recently – the Dow at 26,656.39 on April 23 (not quite new high), the S&P 500 at 2,945.83 on April 30, and the Nasdaq at 8,164 on May 3 – they’ve spent the last three days in the red. Monday, the Dow shed as much as 1.8% before pulling back to close only slightly lower. On Tuesday it had bled 1.8% by the close. The Nasdaq dropped 2.2% during trading before clawing some of that back. It ended trading on Tuesday 2% down.
In fact, the Dow had its worst day yesterday since January 3.
From the sounds of it, investors are unhappy with The Donald’s China trade deal tweets on Sunday. Really, they could have chosen any issue at hand – there are so many – for a reason to correct, but a correction was due regardless… because a pause is needed before the final blow-off rally in my Dark Window scenario.
All the “good news” lately – the lowest unemployment number in the last five decades, average hourly earnings up 3.2% over 2018, first quarter GDP of 3.2%, as Rodney mentioned yesterday – hasn’t given investors sustained confidence because… well… most of them know, like us, that it’s all B.S.
Just hot air…
Employment numbers, GDP “growth,” stock market highs… none of it has any fundamental foundation. It’s all the result of Fed stimulus, the resultant stock buy-backs binge, and then The Donald’s tax cuts last year.
In fact, despite the good Q1 number, our real cumulative GDP growth over the last 11 years has been worse than GDP growth during the Great Depression (19% between 2007 and 2018 compared to 20% between 1929 and 1940).
The fact of the matter is, any connection between the markets and the economy is now tenuous at best. Stocks are 120% overvalued versus my proven Spending Wave, with all of that due to goosing earnings per share versus total earnings through stock buybacks. And that sets us up for the worst kind of thrashing when this bubble bursts.
What Most Don’t See
Most people see that the Fed stopped printing money by late 2014, after tapering their printing gradually over a year. They see that the Fed started raising short-term rates in December 2015. And they see the large corporate tax cuts at the beginning of 2018.
What most people don’t see is the global picture…
Europe started printing again when we tapered in 2014. Talk about tag-team wrestling.
And Japan? It went off the reservation in early 2013, printing at three times the peak rates of Europe or the U.S. as a percent of their GDP, and never slowed down.
Japan’s balance sheet, as a percent of GDP, is now 101%… with most of that added since early 2013.
Europe’s is at 40%.
We’re only at 19%, cumulative, after a peak of 24%. We’re the best house in a worsening neighborhood.
We tapered first. We shifted from lowering to raising short-term rates first. No major central bank has raised short-term rates yet. But we alone passed major tax cuts, which are a direct stimulus to businesses and stock prices. Again, despite this, our real GDP growth is slightly worse than those Great Depression years.
Here’s the big picture on money printing from PIMCO.
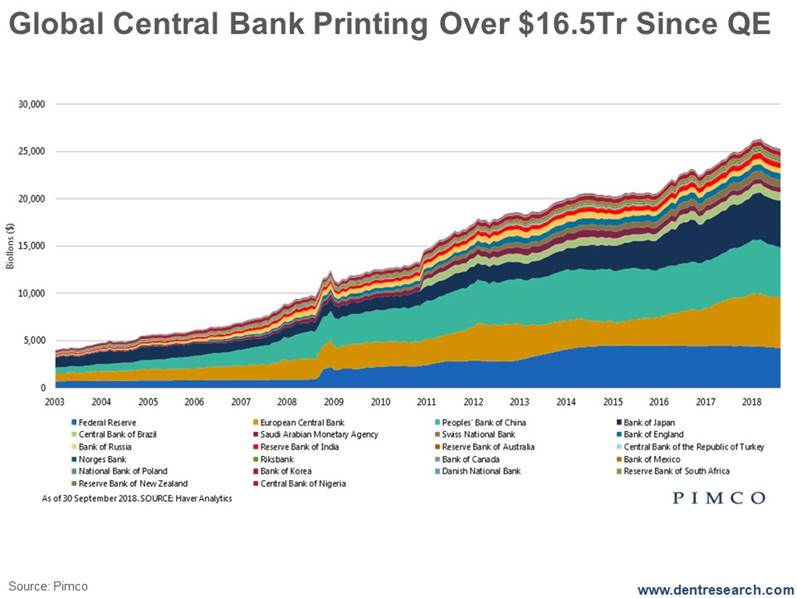
Note that this chart includes the big four – the U.S., ECB, China, and Japan – along with 18 other central banks. Sure, the big four account for about 76% of the global money printing, but that extra 24% is added stimulus that we don’t see or hear about.
At the beginning of 2018, cumulative central bank assets were just over $26 trillion, up 173% since QE started in early 2009.
Our tapering, as long as Trump will permit it to continue, and the little from China have brought that number back down to near $25 trillion. But that won’t last. Not with slowing economies around the world.
Europe has been slowing markedly since the beginning of 2018. Japan is still slowing with breakneck speed.
Every Brick Counts…
Those extra smaller central banks account for about $6 trillion of the total global balance sheet and $3 trillion in additional printing since QE. Nevertheless, it’s more bricks to the wall of money and printing.
That $16.5 trillion of printing we’ve seen since 2007 is 37% of developed country global GDP and 21% of total global GDP. Adding Trump’s tax cuts of $1.5 trillion takes those numbers to 40% and 23%, respectively. That’s enough stimulus to add 4.0% annual growth since 2009 to developed countries, or 2.3% a year to total global GDP…
Yet the best we’ve managed in the U.S. is 3.2% recently for one quarter, and we’ve still averaged closer to 2% since 2008.
Without it all, we would have endured the second Great Depression. Instead, we got a great recession followed by the lowest growth in history.
That doesn’t mean we’ve dodged the bullet. Rather, it means we’ll take the blow at the end of this Economic Winter Season.
The worst part is ahead.
Oh, and right on cue within my 90-year Bubble Buster Cycle!
I have to admit, years ago I didn’t think we could get to where we are today.
The first major financial crisis (in 2008) played right into my demographic Spending Wave cycle, as I forecast all the way back in 1988.
The second major financial crisis just ahead, created entirely by unprecedented central bank stimulus, plays into this most extreme of all 90-year Innovation and Bubble cycles.
This leaves you with two choices: ignore our research and guidance and be wiped out with the majority lead by the nose from central banks and Wall Street… or keep reading and be ready to grab the Dark Window opportunities before it all falls apart AND the sale of a lifetime opportunities that will appear after the great crash ahead.
Harry
Follow me on Twitter @HarryDentjr
P.S. Another way to stay ahead is by reading the 27 simple stock secrets that our Seven-Figure Trader says are worth $588,221. You’ll find the details here.
Harry studied economics in college in the ’70s, but found it vague and inconclusive. He became so disillusioned by the state of the profession that he turned his back on it. Instead, he threw himself into the burgeoning New Science of Finance, which married economic research and market research and encompassed identifying and studying demographic trends, business cycles, consumers’ purchasing power and many, many other trends that empowered him to forecast economic and market changes.
Copyright © 2019 Harry Dent- All Rights Reserved Disclaimer: The above is a matter of opinion provided for general information purposes only and is not intended as investment advice. Information and analysis above are derived from sources and utilising methods believed to be reliable, but we cannot accept responsibility for any losses you may incur as a result of this analysis. Individuals should consult with their personal financial advisors.
© 2005-2022 http://www.MarketOracle.co.uk - The Market Oracle is a FREE Daily Financial Markets Analysis & Forecasting online publication.