


UUP Bullish Cycles from May 2011 lows
Currencies / US Dollar Sep 09, 2019 - 06:48 PM GMT

Firstly the dollar tracking ETF fund UUP inception date was 2/20/2007. Interestingly the dollar index has a low in March 2008. The UUP ETF fund shows a low in May 2011. The dollar index did make a pullback cycle low in May 2011 however it was well above the March 2008 lows. The bullish cycle up from the May 2011 lows in UUP is the focus of this analysis where it begins on the weekly chart. It should see some further upside before any larger size pullbacks relative to the longer term cycles.
The analysis continues below the UUP weekly chart.
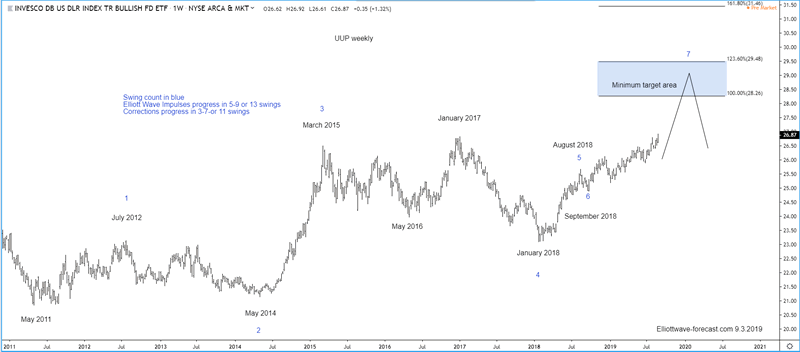
Secondly the bullish cycle up from the May 2011 lows in UUP appears to be advancing higher with some overlap in the cycles. This is as per would any diagonal. However price has marginally got above the January 2017 highs giving the dollar representative instrument a bullish sequence. From the May 2011 lows the dollar instrument appears to have at least 4 swings in place to the January 2018 lows. From there according to the momentum indicators used here it ended a cycle up at the August 2018 highs in a 5th swing. The reason of that being the relatively short in price percentage or time pullback into the September 2018 lows. That was strong enough to suggest it was 6th swing correcting the cycle up from the January 2018 lows.
The analysis continues below the UUP daily chart.
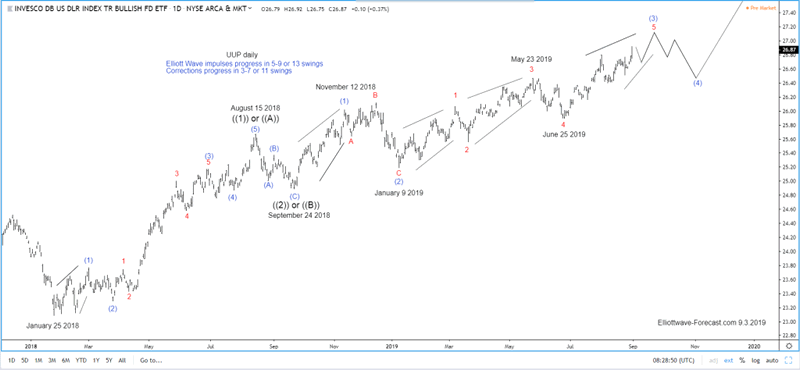
Thirdly and in conclusion, the swing and Elliott Wave count suggests further upside in the dollar. The dollar is bullish while near term dips lower show they will remain above the January 2019 lows, more ideally the June 25th lows. It can see further strength higher toward the 28.26-29.28 area before a significant turn back lower. Thanks for looking. Feel free to come visit our website. Please check out our services Free for 14 days and see if we can be of help.
Kind regards & good luck trading. Lewis Jones of the ElliottWave-Forecast.com Team
By EWF Lewis
https://elliottwave-forecast.com
ElliottWave-Forecast has built its reputation on accurate technical analysis and a winning attitude. By successfully incorporating the Elliott Wave Theory with Market Correlation, Cycles, Proprietary Pivot System, we provide precise forecasts with up-to-date analysis for 52 instruments including Forex majors & crosses, Commodities and a number of Equity Indices from around the World. Our clients also have immediate access to our proprietary Actionable Trade Setups, Market Overview, 1 Hour, 4 Hour, Daily & Weekly Wave Counts. Weekend Webinar, Live Screen Sharing Sessions, Daily Technical Videos, Elliott Wave Setup .
Copyright © 2019 ElliottWave-Forecast - All Rights Reserved Disclaimer: The above is a matter of opinion provided for general information purposes only and is not intended as investment advice. Information and analysis above are derived from sources and utilising methods believed to be reliable, but we cann
© 2005-2022 http://www.MarketOracle.co.uk - The Market Oracle is a FREE Daily Financial Markets Analysis & Forecasting online publication.