Most Popular
1. It’s a New Macro, the Gold Market Knows It, But Dead Men Walking Do Not (yet)- Gary_Tanashian
2.Stock Market Presidential Election Cycle Seasonal Trend Analysis - Nadeem_Walayat
3. Bitcoin S&P Pattern - Nadeem_Walayat
4.Nvidia Blow Off Top - Flying High like the Phoenix too Close to the Sun - Nadeem_Walayat
4.U.S. financial market’s “Weimar phase” impact to your fiat and digital assets - Raymond_Matison
5. How to Profit from the Global Warming ClImate Change Mega Death Trend - Part1 - Nadeem_Walayat
7.Bitcoin Gravy Train Trend Forecast 2024 - - Nadeem_Walayat
8.The Bond Trade and Interest Rates - Nadeem_Walayat
9.It’s Easy to Scream Stocks Bubble! - Stephen_McBride
10.Fed’s Next Intertest Rate Move might not align with popular consensus - Richard_Mills
Last 7 days
Stocks Correct into Bitcoin Happy Thanks Halving - Earnings Season Buying Opps - 4th July 24
24 Hours Until Clown Rishi Sunak is Booted Out of Number 10 - UIK General Election 2024 - 4th July 24
Clown Rishi Delivers Tory Election Bloodbath, Labour 400+ Seat Landslide - 1st July 24
Bitcoin Happy Thanks Halving - Crypto's Exist Strategy - 30th June 24
Is a China-Taiwan Conflict Likely? Watch the Region's Stock Market Indexes - 30th June 24
Gold Mining Stocks Record Quarter - 30th June 24
Could Low PCE Inflation Take Gold to the Moon? - 30th June 24
UK General Election 2024 Result Forecast - 26th June 24
AI Stocks Portfolio Accumulate and Distribute - 26th June 24
Gold Stocks Reloading - 26th June 24
Gold Price Completely Unsurprising Reversal and Next Steps - 26th June 24
Inflation – How It Started And Where We Are Now - 26th June 24
Can Stock Market Bad Breadth Be Good? - 26th June 24
How to Capitalise on the Robots - 20th June 24
Bitcoin, Gold, and Copper Paint a Coherent Picture - 20th June 24
Why a Dow Stock Market Peak Will Boost Silver - 20th June 24
QI Group: Leading With Integrity and Impactful Initiatives - 20th June 24
Tesla Robo Taxis are Coming THIS YEAR! - 16th June 24
Will NVDA Crash the Market? - 16th June 24
Inflation Is Dead! Or Is It? - 16th June 24
Investors Are Forever Blowing Bubbles - 16th June 24
Stock Market Investor Sentiment - 8th June 24
S&P 494 Stocks Then & Now - 8th June 24
As Stocks Bears Begin To Hibernate, It's Now Time To Worry About A Bear Market - 8th June 24
Gold, Silver and Crypto | How Charts Look Before US Dollar Meltdown - 8th June 24
Gold & Silver Get Slammed on Positive Economic Reports - 8th June 24
Gold Summer Doldrums - 8th June 24
S&P USD Correction - 7th June 24
Israel's Smoke and Mirrors Fake War on Gaza - 7th June 24
US Banking Crisis 2024 That No One Is Paying Attention To - 7th June 24
The Fed Leads and the Market Follows? It's a Big Fat MYTH - 7th June 24
How Much Gold Is There In the World? - 7th June 24
Is There a Financial Crisis Bubbling Under the Surface? - 7th June 24

Market Oracle FREE Newsletter

How to Protect your Wealth by Investing in AI Tech Stocks

Larger Bullish Move in USD/JPY May Just Be Getting Started

Currencies / Japanese Yen Nov 05, 2019 - 10:03 AM GMT

By: MarketsToday

Currencies

Summary

  • Once current retracement is complete the USD/JPY has a good chance of exceeding last week’s high.
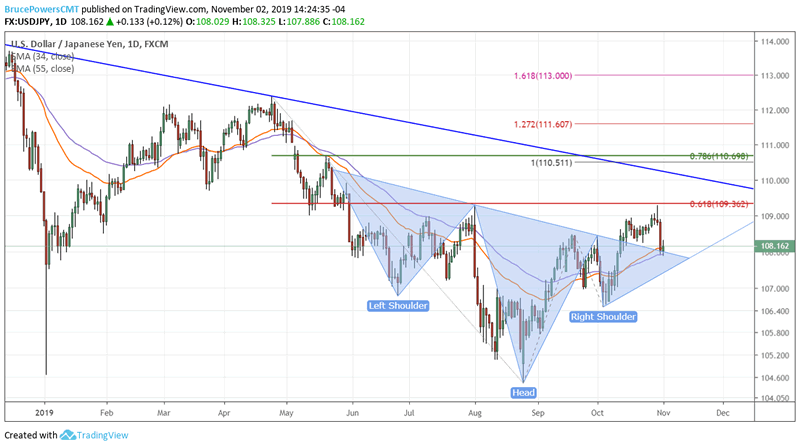
  • Pair still in early stages of following through on bullish breakout of a large head and shoulders bottom.
  • Upside target zone around $110.51 to $110.70.

Following an upside breakout of a large head and shoulders bottom pattern several weeks ago, the USD/JPY pulled back to test support of the neckline last week. So far, the area of the neckline has held as support around $107.88. Whether it continues to do so remains to be seen.


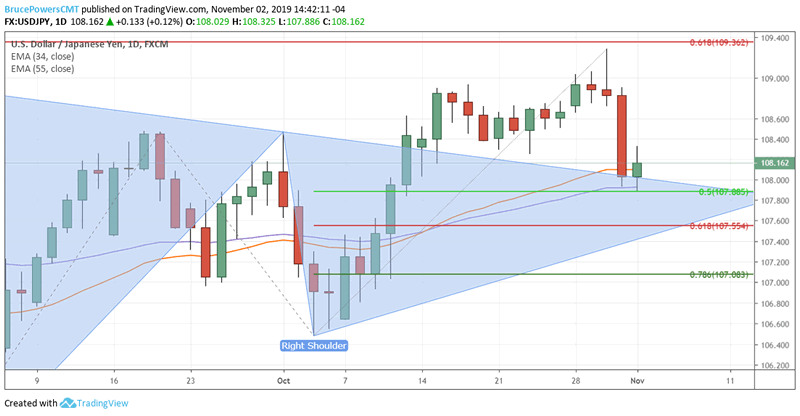
That price area is given greater significance by the fact that it is an exact match with the 50% retracement of the most recent advance off the right shoulder low at $106.48 and the 55-day exponential moving average (ema) (blue line).

This is typical price behavior following a breakout, where price will retrace at least part of its breakout thrust. Initially, the neckline represented resistance, and now potential support. If last week’s low is exceeded to the downside then next watch for signs of support around the 61.8% Fibonacci retracement around $107.55, followed by the 78.6% retracement at $107.08. At the same time, a decisive daily close below the right shoulder indicates a failure of the current head and shoulders bottom pattern structure.

Last week resistance was seen at $109.29, right around the 61.8% Fibonacci retracement of the most recent leg down off the April 2019 swing high of $112.40. Once the current retracement is complete and the bulls return to dominate, the USD/JPY has a good chance of exceeding the recent high and eventually rallying up to the next potential resistance zone from approximately $110.51 to $110.70. That zone consists of the 100% projection of the second leg up off the August bottom (bottom of head) and 78.6% Fibonacci retracement of the prior downtrend, respectively.

Bruce Powers, CMT
Chief Technical Analyst
http://www.marketstoday.net/

© 2019 Copyright Bruce Powers- All Rights Reserved

Disclaimer: The above is a matter of opinion provided for general information purposes only and is not intended as investment advice. Information and analysis above are derived from sources and utilising methods believed to be reliable, but we cannot accept responsibility for any losses you may incur as a result of this analysis. Individuals should consult with their personal financial advisors.


© 2005-2022 http://www.MarketOracle.co.uk - The Market Oracle is a FREE Daily Financial Markets Analysis & Forecasting online publication.


Post Comment

Only logged in users are allowed to post comments. Register/ Log in