


Stock Market Selloff Structure Explained – Fibonacci On Deck
Stock-Markets / Stock Markets 2020 Apr 02, 2020 - 01:53 PM GMTBy: Chris_Vermeulen

Many traders become very emotional when the markets turn Bearish and fail to properly understand that price structure is still driving market price movement. This morning, I highlighted this structure to my subscribers attempting to alert them to the possibility that the markets could recover moderately over the next 3 to 5+ days attempting to set up the next “waterfall” downside price event.
On January 29, 2020, I posted a research article detailing my belief that a “waterfall” type of event was setting up in the markets. This article was nearly 30 days prior to the peak in the markets. It explained how events take place and how markets tend to develop a moderate recovery phase between selloff price declines.
January 29, 2020: ARE WE SETTING UP FOR A WATERFALL SELLOFF?
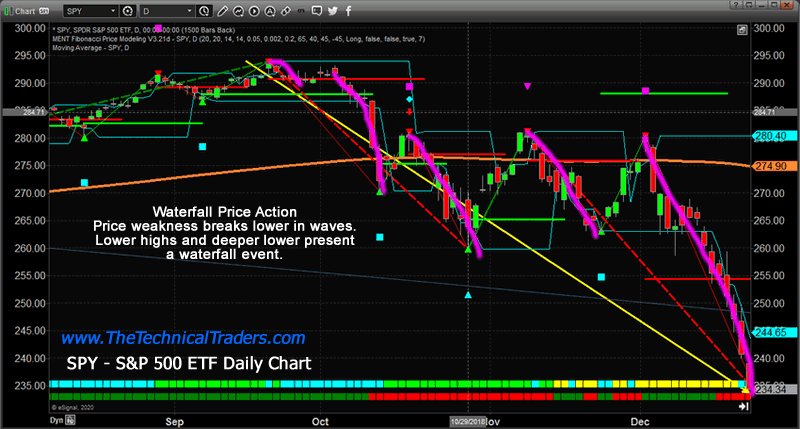
Skilled traders should notice the size and levels of each selloff event in the chart (above) and pay very close attention to how price initially collapsed from the peak, then recovered nearly 50% in early and late November before finally setting up a deeper waterfall price collapse in early December.
Our research team believes the US stock markets may attempt something similar over the next 3 to 5+ days as the Covid-19 economic outcome continues to process through the global markets.
The US and other Central Banks have taken broad steps to attempt to overcome the negative economic outcomes related to the Covid-19 global shutdown. Their biggest concern is that consumer activity could diminish and banking/credit firms could come under severe pressures because of a consumer collapse.
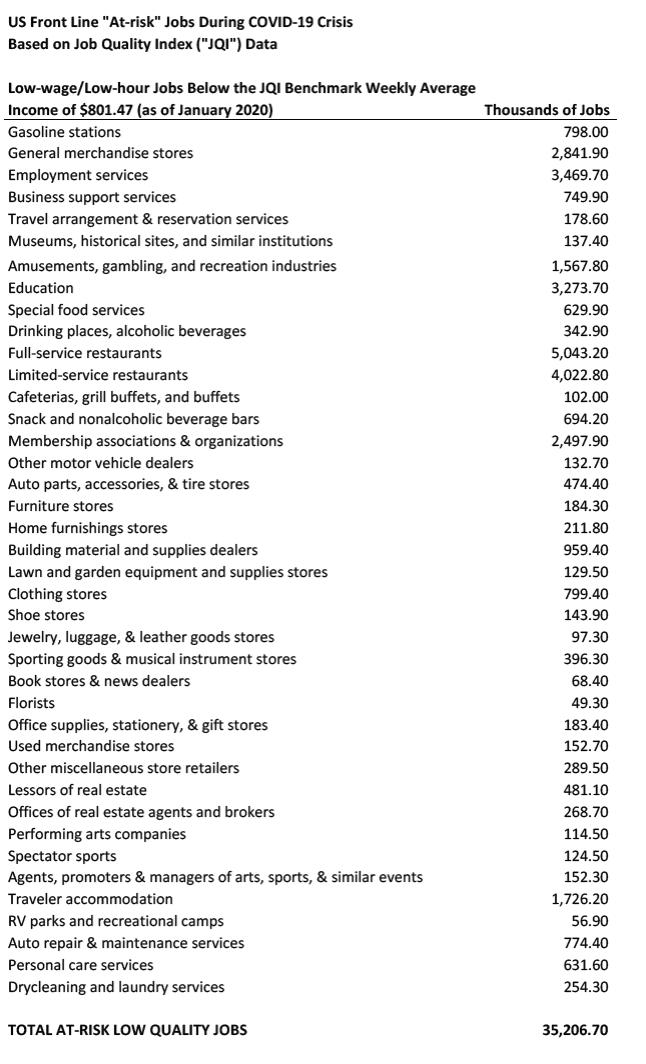
There are over 35 million US low-wage jobs that may become at-risk because of the Covid-19 virus event. We believe the true economic contagion of the global virus event may now be known until well into April or May 2020. Yet we believe these at-risk, low-wage jobs are prevalent throughout the globe and foreign nations, such as Asia and Europe, may experience a similar consumer economic contagion over the next 6+ months.
Before you continue, be sure to opt-in to our free market trend signals before closing this page, so you don’t miss our next special report!
We believe the data related to the Covid-19 economic crisis will not fully be known until well into April or May 2020. Because of this, we believe the US stock markets may recover to levels near the 50% Fibonacci Retracement levels on these charts before attempting a series of further downside price moves. Skilled traders should not become overly emotional right now and pay attention to the structure of the price action as well as other technical conditions in play at the moment. Our objective is to execute trades with a highly targets success rate – not to trade on emotions.
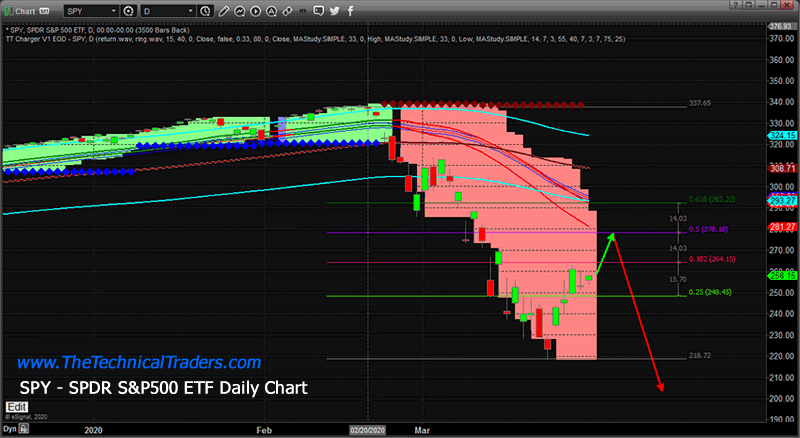
SPY Daily Chart
This SPY Daily chart shows the SPY would only need to rally 18.70 points to reach the 50% Fibonacci retracement level on this chart. This could happen very quickly given how close the price actually is to this key Fibonacci level. If that were to happen over the next 3 to 5+ trading days, the downward sloping price channels from our TTCharger modeling system would move lower to meet price near 278 – which would set up a new resistance zone and possibly a new wave of selling.
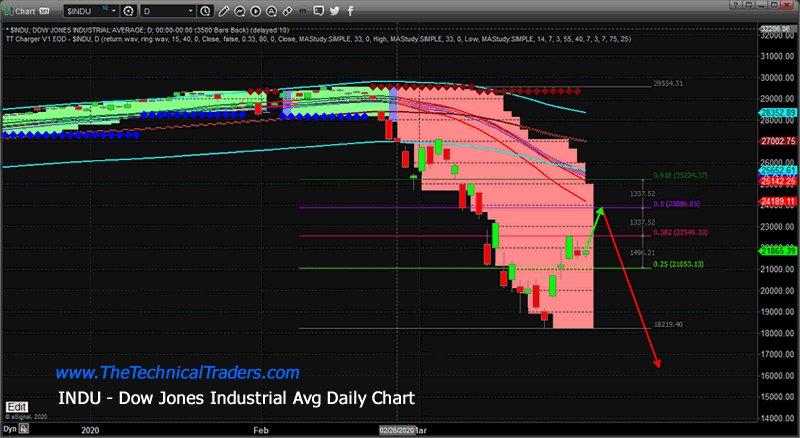
INDU Daily Chart
This INDU Daily chart shows the Dow Jones would have to rally about 2025 points (to levels near 23,886) to reach the 50% Fibonacci Retracement target. If this were to happen, the sloping price channels on this chart would likely move lower to meet price near this 50% target level – presenting a very clear resistance zone for a new wave of selling to begin.
Remember, it is not about emotions or attempting to try to force the markets to adopt your “belief”. Skilled traders attempt to identify risks, opportunities and realistic technical setups that allow them to objectively determine where and when the markets are providing a real opportunity for success.
We may be just a few days away from the next major wave of selling, yet any trader who jumped into an emotional trader over the past 5+ days expecting the markets to continue to break down is likely under a fair amount of stress right now. Learn to read the charts and the structure of price more effectively and you’ll find the answers are already on the charts in front of you.
As a technical analysis and trader since 1997, I have been through a few bull/bear market cycles. I believe I have a good pulse on the market and timing key turning points for short-term swing traders.
If you are a more active trader and swing trader visit my Active ETF Trading Newsletter. If you are a long-term investor looking for signals when to own equities, bonds, or cash, be sure to look into my Long-Term Investing Signals.
Ride my coattails as I navigate these financial markets and build wealth while others lose nearly everything they own during the next financial crisis.
Chris Vermeulen
www.TheTechnicalTraders.com
Chris Vermeulen has been involved in the markets since 1997 and is the founder of Technical Traders Ltd. He is an internationally recognized technical analyst, trader, and is the author of the book: 7 Steps to Win With Logic
Through years of research, trading and helping individual traders around the world. He learned that many traders have great trading ideas, but they lack one thing, they struggle to execute trades in a systematic way for consistent results. Chris helps educate traders with a three-hour video course that can change your trading results for the better.
His mission is to help his clients boost their trading performance while reducing market exposure and portfolio volatility.
He is a regular speaker on HoweStreet.com, and the FinancialSurvivorNetwork radio shows. Chris was also featured on the cover of AmalgaTrader Magazine, and contributes articles to several leading financial hubs like MarketOracle.co.uk
Disclaimer: Nothing in this report should be construed as a solicitation to buy or sell any securities mentioned. Technical Traders Ltd., its owners and the author of this report are not registered broker-dealers or financial advisors. Before investing in any securities, you should consult with your financial advisor and a registered broker-dealer. Never make an investment based solely on what you read in an online or printed report, including this report, especially if the investment involves a small, thinly-traded company that isn’t well known. Technical Traders Ltd. and the author of this report has been paid by Cardiff Energy Corp. In addition, the author owns shares of Cardiff Energy Corp. and would also benefit from volume and price appreciation of its stock. The information provided here within should not be construed as a financial analysis but rather as an advertisement. The author’s views and opinions regarding the companies featured in reports are his own views and are based on information that he has researched independently and has received, which the author assumes to be reliable. Technical Traders Ltd. and the author of this report do not guarantee the accuracy, completeness, or usefulness of any content of this report, nor its fitness for any particular purpose. Lastly, the author does not guarantee that any of the companies mentioned in the reports will perform as expected, and any comparisons made to other companies may not be valid or come into effect.
Chris Vermeulen Archive |
© 2005-2022 http://www.MarketOracle.co.uk - The Market Oracle is a FREE Daily Financial Markets Analysis & Forecasting online publication.