


Stock Market SPX to Gold/Silver Ratios Explored – What To Expect Next
Stock-Markets / Stock Markets 2020 Sep 07, 2020 - 12:14 PM GMTBy: Chris_Vermeulen

RESEARCH HIGHLIGHTS:
- A Phase II rally in metals is just getting ready to start.
- Phase II rallies are very explosive and tend to enter Parabolic trends.
- Gold could rally 250% to 350% over the next several years.
- Silver could rally 550% to 750% over the next several years.
My research team and I started exploring the relationship between the Gold-to-Silver ratio and the S&P 500 to find trends in Metals and the US Stock Markets. We called the collapse in the Gold-to-Silver ratio accurately back in March 2020, and we believe the current setup in the S&P to the Gold-to-Silver ratio shows the move in Precious Metals is far from over.
If you would like to review some of our earlier research posts, please take a minute to review these posts:
August 13, 2020: DETAILED 2020/2021 PRICE FORECASTS FOR GOLD & SILVER
May 15, 2020: SILVER BEGINS TO ACCELERATE HIGHER FASTER THAN GOLD
April 22, 2015: IN THREE TO FIVE YEARS GOLD WILL BE PRICELESS
PLAYING WITH RATIOS – WHAT CAN WE LEARN
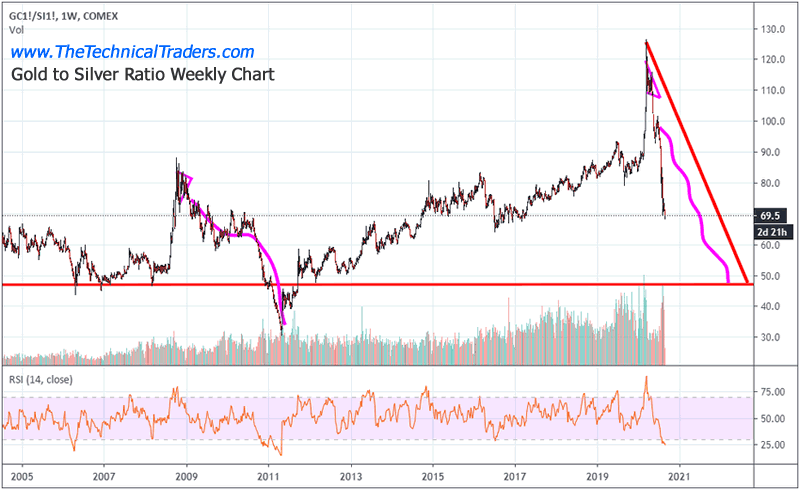
The Weekly Gold-to-Silver ratio chart below highlights our predictions from late March 2020 where we suggested the incredible spike in the ratio value was similar to the spike that took place in 2008. We identified a Flag/Pennant setup after each spike in the ratio volume and predicted a downward ratio decline would continue – pushing both Gold and Silver higher. We also suggested that Silver would begin to rally much faster than Gold throughout this move.
METALS MAY RALLY 350% TO 750% FROM CURRENT LEVELS
Now, with the Gold-to-Silver ratio sitting near 69.50, we believe another important ratio component has come into play for Precious Metals – the S&P to Gold-to-Silver ratio. If our earlier research continue to be correct, then the Gold-to-Silver ratio should continue to decline targeting levels near or below 50 at some point over the next 3+ years.
We believe this process may take place in a very transitional global stock market. When we suggest this term “transitional”, we are suggesting a very fluid and aggressive global stock market where capital will actively move from risks to opportunities very quickly. As the global environment shifts from stability to moderate crisis over the next 3+ years, we believe more and more capital will attempt to find safety in Precious Metals and other safe-havens.
The one thing that is really starting to concern me is the news and talk that the riots and protests in the US may get much worse over the next 6 to 12+ months. From a technical standpoint, it is very difficult to define technical indicators that attempt to quantify the effect of these riots and destruction to local economies. Although, we do have one technical analysis component to rely upon – price – since it always discounts external factors faster than the news can print stories. Because of this, we believe the new ratios we are sharing with you today are very important.
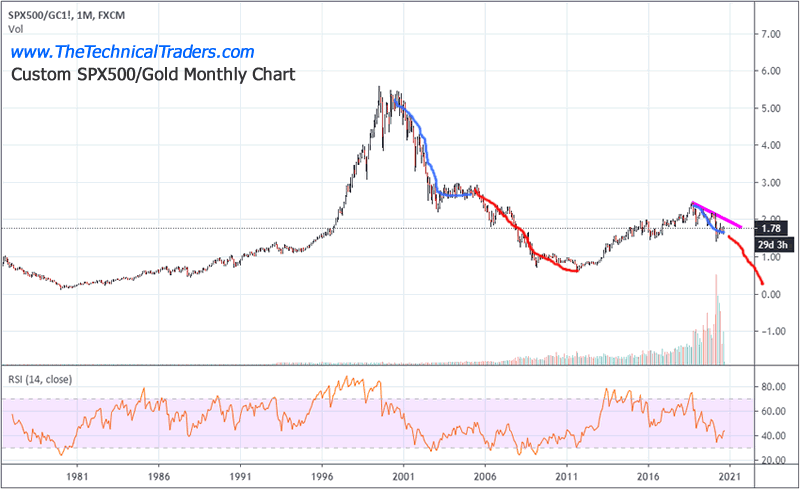
Please take a look below at our new Monthly ratio analysis of the SPX500 to the price of Gold. We believe this ratio chart highlights how global investors are moving away from safety, shown with rising ratio levels on this chart, and back into safety/metals, shown with declining ratio levels on this chart. Let’s take a look at a bit of history.
From 1981 to the peak in 1999 (nearly 18 years), investors shrugged off risk and piled capital into the US and global stock markets as the Reagan, Clinton, and DOT COM rallies ran back-to-back. The ratio rallied from low levels near 0.30 to high levels near 5.60. This represents a tremendous increase in the global stock market valuations while precious metals languished in a lower/sideways price range. Then, in late 1999 and early 2000, the ratio peaked and began to move downward. That downward ratio trend lasted nearly 10 years in total and produced the $1923.70 peak price in Gold in Sept 2011. The real rally in Gold didn’t begin to accelerate until mid-2005 – nearly 5 years after the peak in this ratio chart.
Before you continue, be sure to opt-in to our free-market trend signalsnow so you don’t miss our next special report!
We believe the current move in Gold and Silver is similar to the 2000~2005 initial impulse move after the peak in 1999 (highlighted in LIGHT BLUE). This impulse move sets up a bigger, more aggressive downside price trend as the rally in precious metals accelerates and moves in a parabolic trend when markets near peaks (highlighted in RED). These aggressive moves are typically 2x to 3x (or more) than the normal precious metals price ranges and can be very explosive in nature. If we are correct in our analysis, the end of 2020, and throughout the next 2 to 3+ years, we may enter one of these explosive price phases in precious metals because of the current setup in this SPX500/Gold ratio pattern.
If the ratio declines from the current 1.78 level to a level near 0.40, this would represent a 77% decline. Our researchers believe this could prompt a 250% to 350% rally in Gold if the SPX500 stays above $2,200 (near the recent March 2020 lows). This would suggest that Gold could rally to levels above $5,500 to $7,500 over the next 3+ years.
Our researchers applied the same ratio analysis to Silver. Comparing the SPX500 to Silver ratio setup similar types of patterns, yet we noticed the impulse move in Silver is often shorter in time as Silver attempts to rally faster than Gold to make up for depressed price levels throughout the rally phase of the ratio levels. Silver, as many of us already know, tends to be the forgotten little brother to Gold.
Our researchers believe the impulse move in Silver has already completed. We believe the next phase of the decline in the SPX500/Silver ratio will begin the real fear move in Silver. This suggests a rally to levels above $36 to $45 fairly quickly – which will be very near to the all-time high of $49.82.
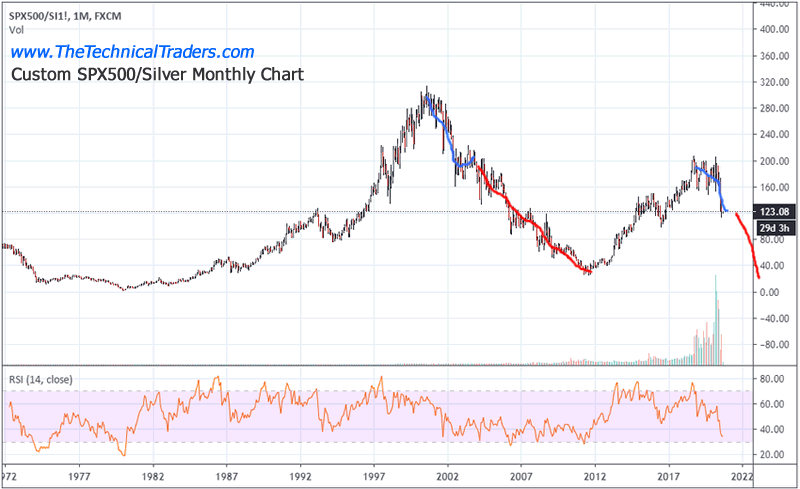
Using similar ratio analysis calculations in the chart below, we believe the upside price target for Silver would target 5.5x to 7.5x current Silver price levels, assuming the ratio level falls to levels below 0.30. That places the ultimate peak level in Silver near $156 to $213. As incredible as that may seem, if the SPX500 stays above the $2,000 price range and does not decline below 2016 lows because of Federal Reserve actions and global central bank support, then a ratio decline targeting recent historically low levels would equate into an even bigger upside price moves in precious metals. The ratio can’t fall to near historic ratio levels unless metals prices rally to levels to offset the advance in the SPX500 price.
As amazing as this may seem for many of you, we want to be one of the first and only research firms to provide technical research to support our predictions. Our past research continues to astound many professionals in the industry. Now, we are making a bold prediction that metals may enter a Phase II rally mode over the next 3 to 6+ months and that new phase may include an incredible parabolic upside price rally. Gold may target $5,500 to $7,500 or more. Silver may target $135 to $213 or higher. These are 350% to 750% price rallies in Gold and Silver – they are absolutely HUGE and a once-in-a-lifetime opportunity.
The last thing we want you to consider is that each of these research charts suggests these trends and cycles last about 7.5 to 11.5 years (on average). If this trend continues and we are only about 2.5 to 3 years into this current trend, then we have another 5 to 7+ years of upward trending in Gold and Silver before a peak price level may setup. If this research helps you better understand the opportunities setting up in Precious Metals, then take a minute to visit www.TheTechnicalTraders.com to learn more about how we help our members find better trades and protect their assets.
Isn’t it time you learned how I can help you better understand technical analysis as well as find and execute better trades? If you look back at past research, you will see that my incredible team and our proprietary technical analysis tools have shown you what to from the markets in the future. Do you want to learn how to profit from these expected huge moves? If so, sign up for my Active ETF Swing Trade Signals today!
If you have a buy-and-hold or retirement account and are looking for long-term technical signals for when to buy and sell equities, bonds, precious metals, or sit in cash then be sure to subscribe to my Passive Long-Term ETF Investing Signals to stay ahead of the market!
Chris Vermeulen
www.TheTechnicalTraders.com
Chris Vermeulen has been involved in the markets since 1997 and is the founder of Technical Traders Ltd. He is an internationally recognized technical analyst, trader, and is the author of the book: 7 Steps to Win With Logic
Through years of research, trading and helping individual traders around the world. He learned that many traders have great trading ideas, but they lack one thing, they struggle to execute trades in a systematic way for consistent results. Chris helps educate traders with a three-hour video course that can change your trading results for the better.
His mission is to help his clients boost their trading performance while reducing market exposure and portfolio volatility.
He is a regular speaker on HoweStreet.com, and the FinancialSurvivorNetwork radio shows. Chris was also featured on the cover of AmalgaTrader Magazine, and contributes articles to several leading financial hubs like MarketOracle.co.uk
Disclaimer: Nothing in this report should be construed as a solicitation to buy or sell any securities mentioned. Technical Traders Ltd., its owners and the author of this report are not registered broker-dealers or financial advisors. Before investing in any securities, you should consult with your financial advisor and a registered broker-dealer. Never make an investment based solely on what you read in an online or printed report, including this report, especially if the investment involves a small, thinly-traded company that isn’t well known. Technical Traders Ltd. and the author of this report has been paid by Cardiff Energy Corp. In addition, the author owns shares of Cardiff Energy Corp. and would also benefit from volume and price appreciation of its stock. The information provided here within should not be construed as a financial analysis but rather as an advertisement. The author’s views and opinions regarding the companies featured in reports are his own views and are based on information that he has researched independently and has received, which the author assumes to be reliable. Technical Traders Ltd. and the author of this report do not guarantee the accuracy, completeness, or usefulness of any content of this report, nor its fitness for any particular purpose. Lastly, the author does not guarantee that any of the companies mentioned in the reports will perform as expected, and any comparisons made to other companies may not be valid or come into effect.
Chris Vermeulen Archive |
© 2005-2022 http://www.MarketOracle.co.uk - The Market Oracle is a FREE Daily Financial Markets Analysis & Forecasting online publication.