


Congressional Budget Office Tax Revenues Set to Surge! In 2 Years, That Is
Economics / US Economy Oct 03, 2020 - 04:23 PM GMTBy: John_Mauldin

All debt shares one common characteristic. A bill comes due at some point and, if the borrower doesn’t pay, the lender either loses their money or finds someone else to pay.
I’ve warned for several years now that our growing global debt load is unpayable. We will eventually “reorganize” it in what I call The Great Reset, likely later in this decade.
Recent developments suggest debt will be even bigger than I expected, to the tune of $50 trillion in the US by 2030. That's double what I expected just one year ago.
Way back in June 2019, I wrote a series of letters responding to Ray Dalio on government debt and related issues. In one of them I showed a series of spending and revenue charts my associate Patrick Watson prepared from Congressional Budget Office projections.
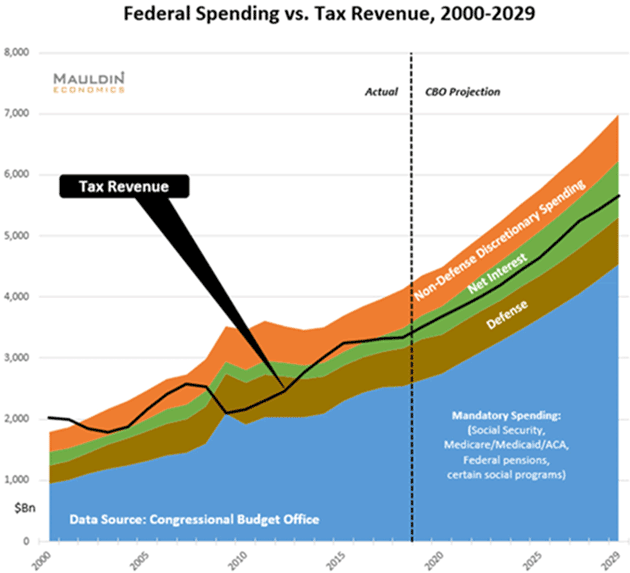
Here is the primary one, exactly as published in June 2019.
Again, the underlying spending and revenue numbers came straight from CBO. They make numerous unrealistic assumptions yet still show a bleak picture.
I noted at the time:
"Under these projections, total federal debt will rise to $25 trillion sometime in 2021. If there is a new president, he or she will not have enough time to change that. Total debt by the end of the decade will rise to the mid-$30-trillion range. …
"The CBO also assumes the bond market can and will absorb almost $35 trillion worth of US government debt. When combined with state and local debt it will easily exceed $35 trillion. (State and local debt is already over $3 trillion. It will certainly rise in the next 10 years.)"
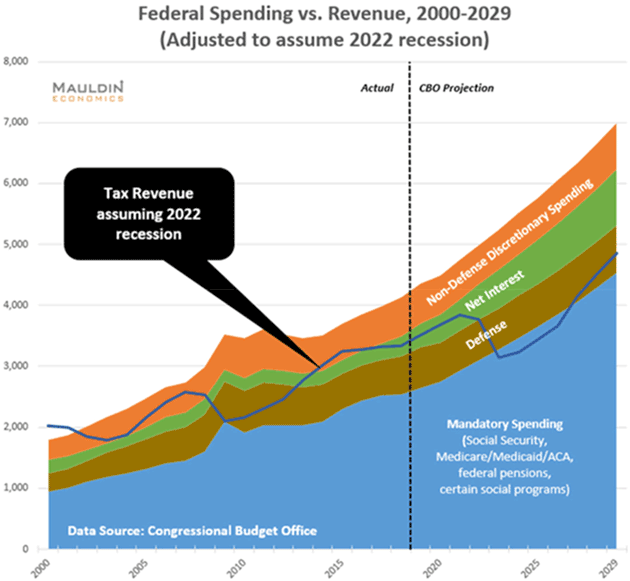
I also asked what would happen if we had a recession in 2022. I assumed the deficit would rise to over $2 trillion annually and pretty much stay that way for the rest of the decade.
It turns out we had a much deeper recession in 2020. I was such an optimist.
Anyway, this was my forecast in January 2020:
Now let’s fast-forward. The CBO just published its latest review. We updated the chart with CBO’s new numbers. It looks a little different now.
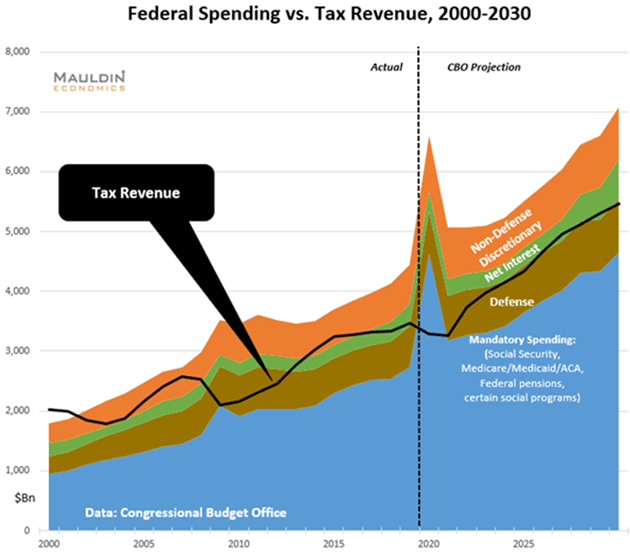
The most obvious change is a big spike in the blue “Mandatory Spending” area. That’s the unemployment and other benefits triggered by the recession.
Less obvious is a small dip in tax revenue, after which the line continues upward as before.
Even with the optimistic V-shaped recovery assumption, revenues barely cover mandatory spending (basically entitlements and social programs), defense, and only a little of the actual interest costs.
Let’s dig into that a little more. Here is a table summarizing federal revenue. The 2019 line is actual; the rest are CBO projections.
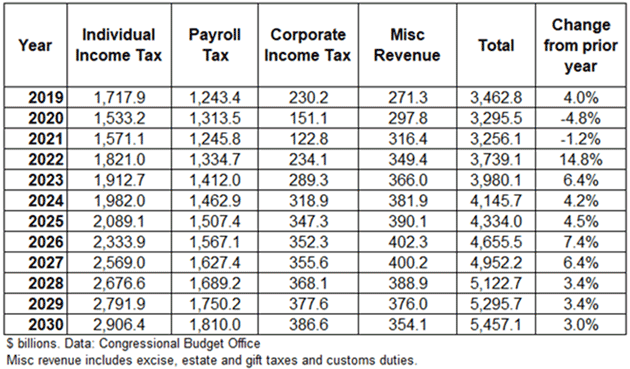
We see that, in this severe recession year, CBO expects federal revenue will drop 4.8%, then fall another 1.2% in FY 2021… and then SURGE 14.8% in 2022.
Definitely a rocket-fueled V-shape recovery. Realistic? I don’t think so.
In 2008, federal revenue fell 1.7% and then plunged 16.6% in 2009. It didn’t fully recover until 2013, three years after the recession ended.
And that recession was mild compared to this one, where we are in a stall speed economy.
Even more absurdly, CBO projects payroll taxes will actually rise this year despite record-high unemployment.
Now, it’s true that the unemployed population tends to be lower-income workers (so far) with smaller tax liabilities. And payrolls were normal until almost halfway through the fiscal year.
But for revenue to actually rise seems unlikely. It stretches credulity to think total US worker income will be slightly larger in 2021 than in 2019. But that’s what CBO forecasts.
This matters because these revenue assumptions go into the deficit estimates, which tell us how much federal debt will grow. (Spending assumptions are also absurd but set them aside for now.)
Note, also, the substantial and uninterrupted revenue growth they project from 2022 through 2030. The last remotely comparable period was the 1990s.
It projects this revenue growth because it projects uninterrupted GDP growth, and especially high GDP growth in the next few years.
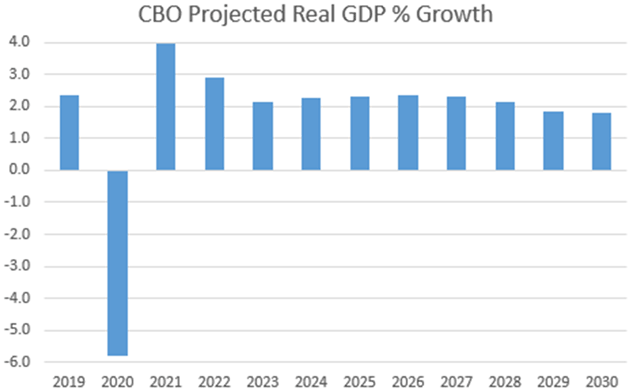
The CBO is mandated by law to make the projections under current law as written and forced to make (within guidelines) positive projections. They don’t have the luxury of assuming there might be a recession in the future.
You wouldn’t hire a financial planner who used software that was guaranteed to give you an unrealistic projection with nothing but positive assumptions. Yet that’s what we do with the CBO numbers.
We all want to see a V-shaped recovery. But with federal debt held by the public at 98% of GDP by year-end, the only V-shape we see right now is a boomerang that's bringing even more debt our way.
The Great Reset: The Collapse of the Biggest Bubble in History
New York Times best seller and renowned financial expert John Mauldin predicts an unprecedented financial crisis that could be triggered in the next five years. Most investors seem completely unaware of the relentless pressure that’s building right now. Learn more here.
Disclaimer: The above is a matter of opinion provided for general information purposes only and is not intended as investment advice. Information and analysis above are derived from sources and utilising methods believed to be reliable, but we cannot accept responsibility for any losses you may incur as a result of this analysis. Individuals should consult with their personal financial advisors.
John Mauldin Archive |
© 2005-2022 http://www.MarketOracle.co.uk - The Market Oracle is a FREE Daily Financial Markets Analysis & Forecasting online publication.