


TREASURY YIELDS SUGGEST A TOP WITHIN THE NEXT 6 MONTHS
Interest-Rates / US Bonds Feb 07, 2021 - 09:08 AM GMTBy: Chris_Vermeulen

Historically, whenever the Treasury Yields fall below zero, then recover back above zero, the US/Global markets reach some peak in price levels within 3 to 8+ months. My research team and I believe the actions of the global markets may be setting up for a future peak in price levels sometime in next 6 months. We believe this will start when the Treasury Yields cross above the “Breakdown Threshold”.
expect A Continued Rally As Long As Yields Stay Below Certain Levels
In 1998, a very brief drop below zero in yields prompted a minor pullback in the markets before the bigger top setup in 2000. This pullback in price aligned with what we are calling the “Breakdown Threshold” level on Yields near 1.20. After the Yields crossed this Threshold, briefly, in 1999, they fell back below this level and the US stock market continued to rally toward an ultimate peak in 2000.
In late 2000, Yields collapsed well below the zero levels and recovered back above zero in early 2001. Just 3+ months later, Yields had rallied above the Breakdown Threshold level (1.2) and the US stock markets had already begun to breakdown as well. This instance, the 2000-01 peak, took place after an Appreciation cycle phase prompted an Excess Phase Rally (the DOT COM bubble). The “Rollover Top” that took place near this top may be similar to what we see happen in 2021 if our research is correct.
In late 2006, Yields again collapsed well below the zero level and recovered back above zero near mid 2007. This time, Yields stalled a bit in their advance higher and clearly broke above the Breakdown Threshold in early 2008. By this time, the US markets had already moved into a sideways/rollover topping formation and began to decline sharply after the Breakdown Threshold was breached.
Be sure to sign up for our free market trend analysis and signals now so you don’t miss our next special report!
What we find interesting about this research is that as long as the Treasury Yields fail to rally above the 1.2 Breakdown Threshold, the market dynamics appear to support a “melt-up” type of trend. Even though traders should understand the risks are starting to become excessive based on this type of pattern, the markets continue to push higher as long a Yield levels stay below the Breakdown Threshold after reaching the Setup Threshold. It is our belief that the Setup Threshold must be breached (to the downside) for this topping pattern to really anchor into place.
Looking at the chart below, in 1996 (highlighted in BLUE) the Setup Threshold was breached, but the Zero level was not breached by Yields. When Yields rallied back above the Breakdown Threshold, a minor sideways price correction took place (briefly). As Yields fell back below the Breakdown Threshold (while never breaching the Setup Threshold), the stock market rallied strongly – resulting in a 90% price rally before the Yields broke the zero level in 1998.
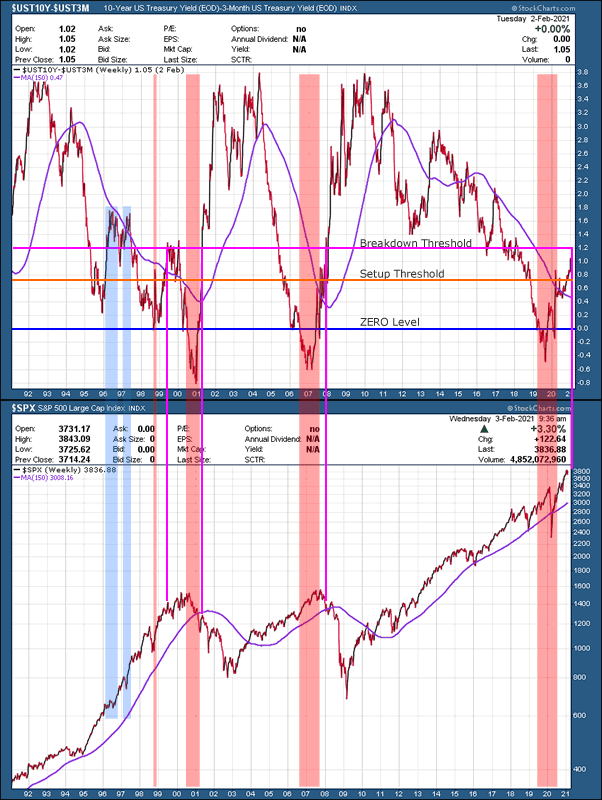
Currently, the Yields level has broken below the zero level and the Setup Threshold, thus there is a high probability that any advance above the Breakdown Threshold will prompt a moderately strong price correction in the US stock markets. If Yields continue to rally higher, we can expect the broader market to move down, possibly starting a new bearish price trend.
Depending on what Treasury yields do from this point forward, we could expect a number of different outcomes. We’ve attempted to highlight various outcomes on the chart below in different colors.
- RED: If Treasury Yields rally above the Breakdown Threshold and continue to push higher, then there is a very strong potential that the US/Global markets will enter a deep correction phase and/or bearish trending cycle.
- BLUE: If Treasury Yields rally above the Breakdown Threshold, then stall and fall back below this level fairly quickly, there is a strong potential that the US stock markets will stall and briefly contract before resuming a “melt-up/bullish trend”. This “fluttering” near the Breakdown level may be indicative of uncertainty in the markets or global central banks attempting to push capital resources into the markets to push the economy into a recovery mode.
- MAGENTA: if Treasury Yields fail to breach the Breakdown Threshold, there is a very strong likelihood that the US stock markets will continue to trend higher (in an Excess Phase mode) prompting a series of new higher closes over time. Our researchers believe we are currently within an Excess Phase topping setup. So, if Yields fail to breach the Breakdown Threshold, it is very likely that the Excess Phase rally will continue (which would be very similar to 1996~1998 in terms of potential price appreciation).
What this means for traders is that we could see very big, broad market sector moves over the next 12 to 24+ months. These charts suggest we will either see a continued price rally or some type of moderate price breakdown in the near future depending on how Treasury Yields react near the Breakdown Threshold. 2021 is going to be a very exciting year for traders – big trends, big sector moves, and the potential for a very big shift in the global markets. Now that you have this research, you can plan and prepare for the risks and trends that are setting up right now.
Don’t miss the opportunities in the broad market sectors over the next 6+ months, which will be an incredible year for traders of the BAN strategy. You can sign up now for my FREE webinar that teaches you how to find, enter, and profit from only those sectors that have the most strength and momentum. As some sectors fail, others will begin to trend higher. Learn how BAN Trader Pro can help you spot the best trade setups; staying ahead of sector trends is going to be key to success in these markets.
For those who believe in the power of trading on relative strength, market cycles, and momentum but don’t have the time to do the research every day then my BAN Trader Pro newsletter service does all the work for you. In addition to trade alerts that can be entered into at the end of the day or the following morning, subscribers also receive a 7-10 minute video every morning that walks you through the charts of all the major asset classes. For traders that want more trading than our 20-25 alerts per year, we provide our BAN Trader Pro subscribers with our BAN Hotlist of ETFs that is updated each day. We issued a new trade alert for our subscribers today and all four trades are well on their way to great returns!
Have a great weekend!
Chris Vermeulen
www.TheTechnicalTraders.com
Chris Vermeulen has been involved in the markets since 1997 and is the founder of Technical Traders Ltd. He is an internationally recognized technical analyst, trader, and is the author of the book: 7 Steps to Win With Logic
Through years of research, trading and helping individual traders around the world. He learned that many traders have great trading ideas, but they lack one thing, they struggle to execute trades in a systematic way for consistent results. Chris helps educate traders with a three-hour video course that can change your trading results for the better.
His mission is to help his clients boost their trading performance while reducing market exposure and portfolio volatility.
He is a regular speaker on HoweStreet.com, and the FinancialSurvivorNetwork radio shows. Chris was also featured on the cover of AmalgaTrader Magazine, and contributes articles to several leading financial hubs like MarketOracle.co.uk
Disclaimer: Nothing in this report should be construed as a solicitation to buy or sell any securities mentioned. Technical Traders Ltd., its owners and the author of this report are not registered broker-dealers or financial advisors. Before investing in any securities, you should consult with your financial advisor and a registered broker-dealer. Never make an investment based solely on what you read in an online or printed report, including this report, especially if the investment involves a small, thinly-traded company that isn’t well known. Technical Traders Ltd. and the author of this report has been paid by Cardiff Energy Corp. In addition, the author owns shares of Cardiff Energy Corp. and would also benefit from volume and price appreciation of its stock. The information provided here within should not be construed as a financial analysis but rather as an advertisement. The author’s views and opinions regarding the companies featured in reports are his own views and are based on information that he has researched independently and has received, which the author assumes to be reliable. Technical Traders Ltd. and the author of this report do not guarantee the accuracy, completeness, or usefulness of any content of this report, nor its fitness for any particular purpose. Lastly, the author does not guarantee that any of the companies mentioned in the reports will perform as expected, and any comparisons made to other companies may not be valid or come into effect.
Chris Vermeulen Archive |
© 2005-2022 http://www.MarketOracle.co.uk - The Market Oracle is a FREE Daily Financial Markets Analysis & Forecasting online publication.