


The Commodity Cycle
Commodities / Commodities Trading Feb 18, 2021 - 12:05 PM GMTBy: Donald_W_Dony

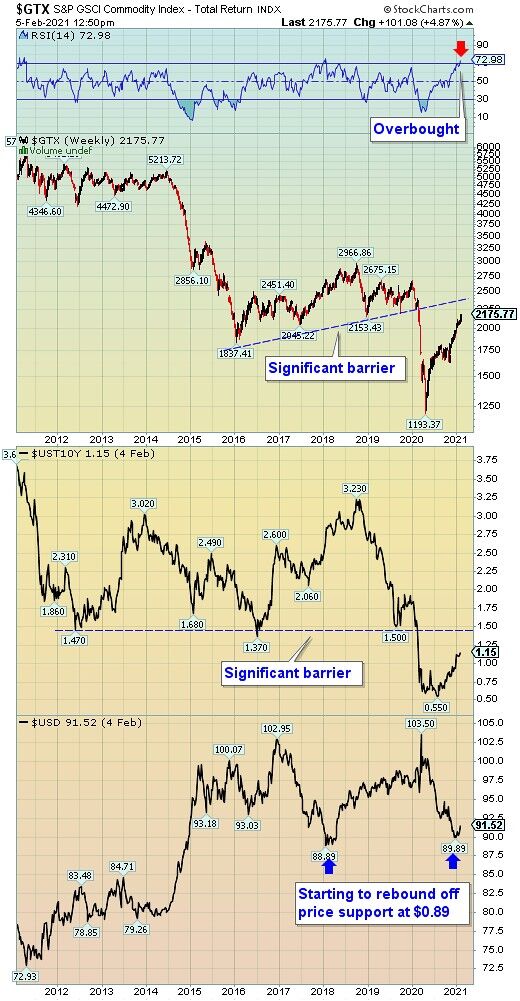
Commodity prices have remained in a prolonged downward trend since the price peak in mid-2008. Driven lower by a firming U.S. dollar (DXY) beginning in 2008-2011 and continuing until the present, the S&P GSCI Commodity Index has declined by about 80 percent over the last 13 years.
The recent rally in the S&P GSCI Commodity Index (GTX) in 2020 appears to be a reaction to the DXY price weakness and the rebound in the U.S. 10 year T-bond yields. The GTX Index moves in the opposite trend to the dollar and in a similar path to the T-bond yields (Chart1).
However, several actions are starting to develop that may alter the trading direction of the commodity index.
The GTX Index is overbought and nearing a significant resistance barrier at 2300 to 2400. The U.S. 10 year T-bond yields are still rising but approaching a primary yield barrier at 1.45-1.50 percent. And the U.S. dollar Index appears to have bottomed and starting to rise after an 8 percent decline in Q3/Q4.
All these market indicators suggest the S&P GSCI Commodity Index will likely stall in early Q2/21.
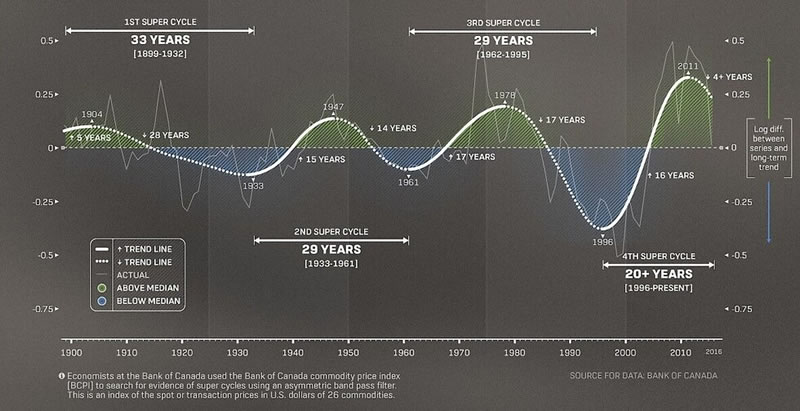
Chart 2 represents the longer term price action of commodities. According to research data collected by the economists at the Bank of Canada, these "Super Cycles" last, on average about 29 years, trough to trough. Based on the last three cycles, each leg (up and down) lasts on average about 15.8 years. As the current commodity cycle peaked in 2011, the next low is expected in 2025 to 2026. At which time a new commodity cycle is expected to begin.
Bottom line: The recent up-tick in the S&P GSCI Commodity Index is expected to reach significant price resistance around the 2300 to 2400 range. This barrier will be due to the rising U.S. dollar (which moves in the opposite direction to natural resource prices) and the expected stall in U.S. 10 year T-bond yields at 1.45 to 1.50 percent (which moves in the same direction as natural resource prices).
Also, the long term movement in commodity prices (Chart 2) implies a more downward trend should be expected during this phase of the "Super Cycle".
By Donald W. Dony, FCSI, MFTA
www.technicalspeculator.com
COPYRIGHT © 2020 Donald W. Dony
Donald W. Dony, FCSI, MFTA has been in the investment profession for over 20 years, first as a stock broker in the mid 1980's and then as the principal of D. W. Dony and Associates Inc., a financial consulting firm to present. He is the editor and publisher of the Technical Speculator, a monthly international investment newsletter, which specializes in major world equity markets, currencies, bonds and interest rates as well as the precious metals markets.
Donald is also an instructor for the Canadian Securities Institute (CSI). He is often called upon to design technical analysis training programs and to provide teaching to industry professionals on technical analysis at many of Canada's leading brokerage firms. He is a respected specialist in the area of intermarket and cycle analysis and a frequent speaker at investment conferences.
Mr. Dony is a member of the Canadian Society of Technical Analysts (CSTA) and the International Federation of Technical Analysts (IFTA).
Donald W. Dony Archive |
© 2005-2022 http://www.MarketOracle.co.uk - The Market Oracle is a FREE Daily Financial Markets Analysis & Forecasting online publication.