


Gold Price Outlook: The Inflation Chasm Between Europe and the US
Commodities / Gold and Silver 2021 Oct 10, 2021 - 09:29 PM GMTBy: P_Radomski_CFA

With inflation more than two times lower in Europe than in the US, the divergence between the economic zones deepens day by day. How might it impact gold?
QE Infinity
While I’ve warned on several occasions that the Fed and the ECB are worlds apart, the latter now wants to provide more QE once it concludes QE. To explain, with the ECB’s PEPP program set to expire at the end of March 2022, the central bank is increasingly worried about a bond market sell-off. And with sluggish Eurozone growth, exorbitant sovereign debt and a lack of fiscal impulse increasing the ECB’s anxiety, officials are studying “alternatives” to suppress interest rates in the Eurozone’s most debt-ridden countries.
Please see below:
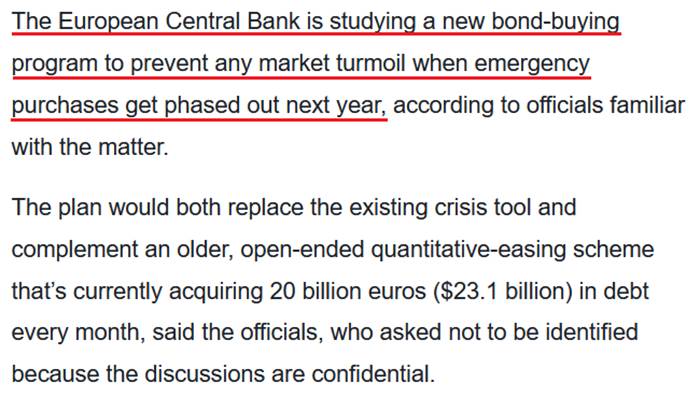
Source: Bloomberg
For context, I’ve been warning for months that the ECB would disappoint euro bulls.
I wrote on Apr. 27:
Recent whispers of the ECB tapering its bond-buying program are extremely premature. With the European economy still drastically underperforming the U.S., it’s actually more likely that the ECB increases the pace of its bond-buying program. Case in point: while the EUR/USD ignores the reality, last week’s PEPP purchases (€22.2 billion) by the ECB were the highest since June 2020. Moreover, since its March meeting, the ECB has increased its average daily PEPP purchases per week from €2.90 billion to €3.60 billion.
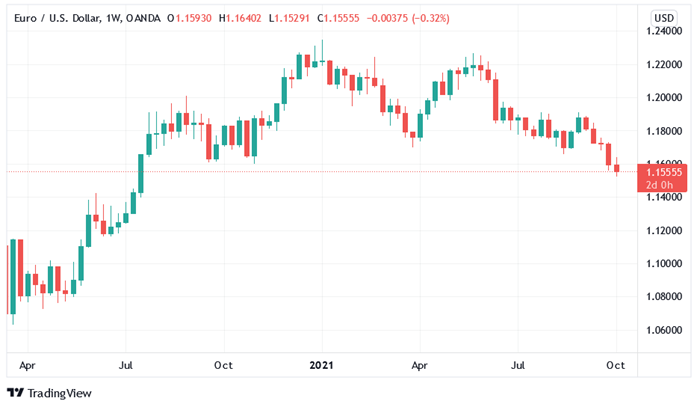
To that point, with reality in fashion once again, the EUR/USD closed at a new 2021 low on Oct. 6 and sunk to its lowest level since July 2020. For context, the EUR/USD accounts for nearly 58% of the movement of the USD Index, and the performance of the currency pair is material.
Please see below:
Furthermore, with the Fed closing in on a taper announcement and the ECB searching for new ways to extend QE, the divergence is profoundly bullish for the U.S. dollar. To explain, rising Eurozone inflation (which pales in comparison to the U.S.) underwrote misguided optimism for a hawkish shift. However, ECB President Christine Lagarde reiterated her dovish stance on Oct. 5, saying that “we should not overreact to supply shortages or rising energy prices, as our monetary policy cannot directly affect those phenomena.”
The Inflation Divergence Is Profound
Moreover, while the Eurozone headline Harmonized Index of Consumer Prices (HICP) increased by 3.4% year-over-year (YoY) in September (released on Oct. 1), the U.S. headline HICP surged by 6.77% in its latest print (released on Aug. 18). Even more revealing, if you exclude the inflationary impacts of food and energy prices, the Eurozone core HICP only increased by 1.9% YoY in September.
Please see below:
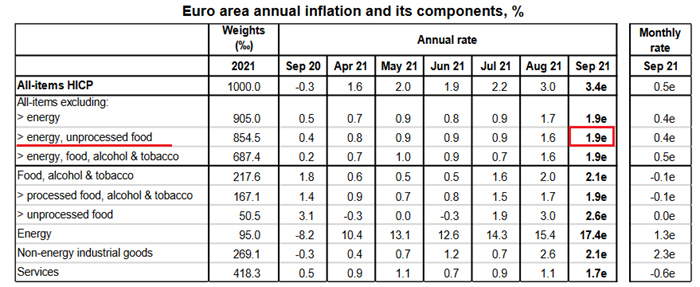
Source: Eurostat
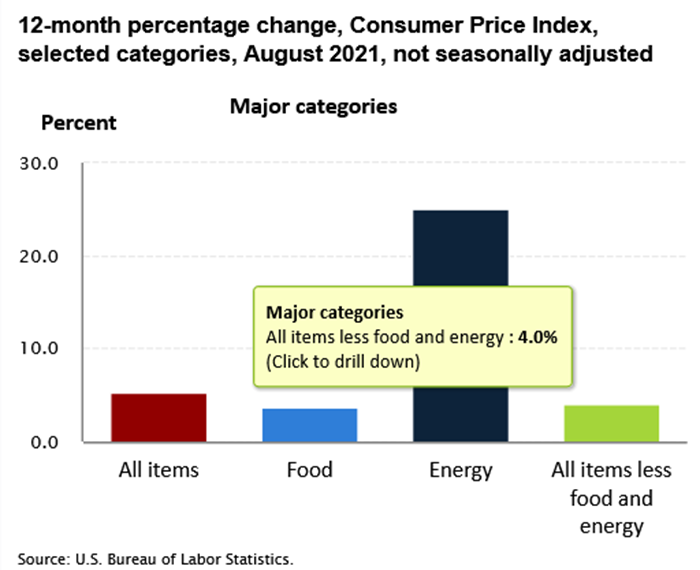
In stark contrast, the U.S. core Consumer Price Index (CPI) – which also excludes the inflationary impacts of food and energy prices and the latest release is more current than the U.S. HICP – increased by 4% YoY in August (released on Sep. 14).
Please see below:
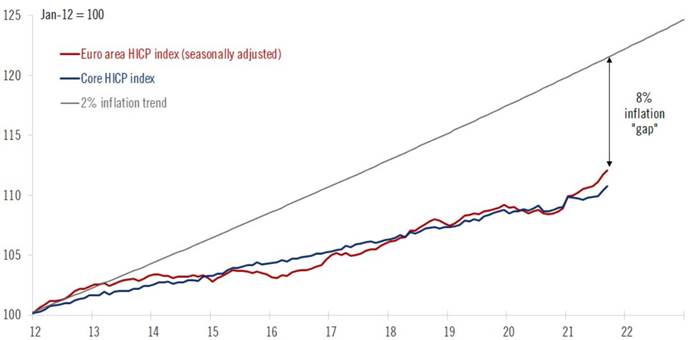
In addition, while the Eurozone headline HICP at 3.4% YoY is still higher than the ECB’s 2% annual inflation target, it’s important to keep things in perspective. For example, since Lagarde has been leading the ECB, the Eurozone headline and core HICP have trended 0.8% and 1.7% below her annual targets. What’s more, when indexed from the beginning of 2012, Eurozone headline HICP is still 8% below the ECB’s 2% annual inflation trend.
Please see below:
Source: Frederik Ducrozet
To explain, the red and blue lines above track the index levels of the Eurozone headline and core HICP, while the gray line above tracks the index level assuming the ECB has been meeting its 2% annual inflation target since the beginning of 2012. If you analyze the material gap on the right side of the chart, you can see that the ECB is far from achieving its objectives.
Likewise, if we zoom in on the roughly two-year chart, both the Eurozone headline and core HICP are still tracking materially below the ECB’s annual inflation targets.
Please see below:
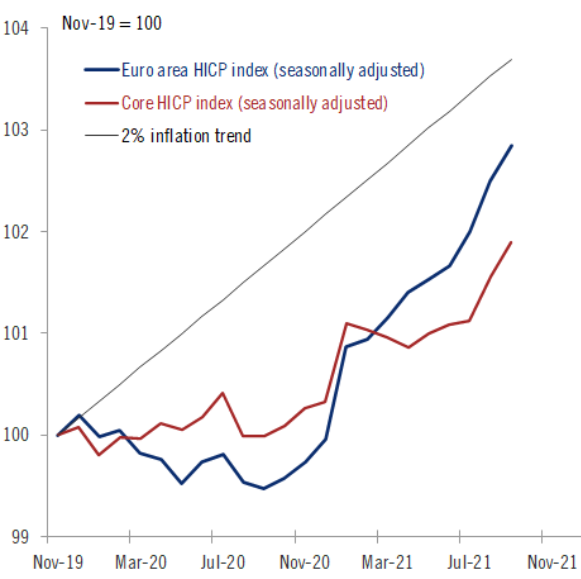
Source: Frederik Ducrozet
Cyclical Slowdown Ahead?
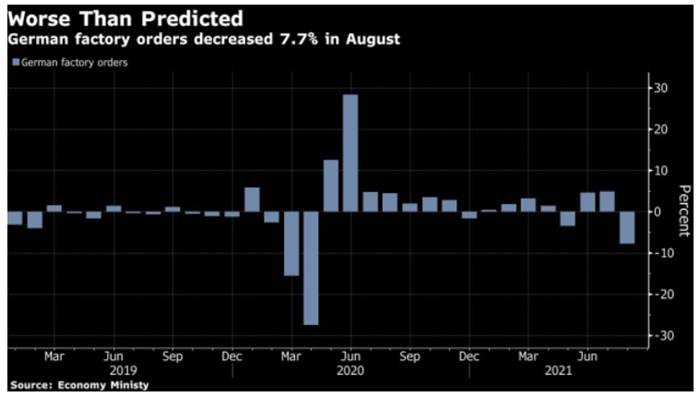
Furthermore, while the ECB studies “alternatives” to prevent interest rates from spiking in high-debt countries like Greece, Italy and Portugal, Germany – Europe’s largest economy – has suffered a significant economic setback. To explain, Germany is a manufacturing-heavy economy and exports are an important component of German GDP. However, with German factory orders plunging by 7.7% on Oct. 6 – with foreign demand down by 9.5% and domestic demand down by 5.2% – it was the sharpest month-over-month (MoM) decline since April 2020. For context, the consensus estimate was for a 2.1% decline.
Please see below:
Piecing it all together, with interest rate anxiety merging with a cyclical slowdown in Europe, Danske Bank expects lower-for-longer ECB policy to contribute to a lower-for-longer EUR/USD. The Danish bank’s strategists told clients:
“There has been no shortage of calls for EUR/USD to 1.30, of pieces written on a regime shift having happened in fiscal policy, oversubscription to social bonds and much more. However, narratives change…. Stagflation, rapid cyclical slowdown, rising interest rates and a correction in valuations may prove to be a very negative capital shock to the euro area and its asset prices. We target 1.13 in spot EUR/USD in the next year but if stagflation, cyclical slowdown and rising rates become dominant themes, then there seem to be clear downside to such estimate.”
Adding to the bearish euro thesis, with U.S. nonfarm payrolls scheduled for release on Oct. 8, a strong print could usher the EUR/USD even lower. For example, ADP’s private payrolls came in at 568,000 vs. 428,000 expected on Oct. 6. And though ADP’s data is an extremely poor predictor of U.S. nonfarm payrolls, Nela Richardson, chief economist at ADP, provided the following context:
“The labor market recovery continues to make progress despite a marked slowdown from the 748,000 job pace in the second quarter. Leisure and hospitality remains one of the biggest beneficiaries to the recovery, yet hiring is still heavily impacted by the trajectory of the pandemic, especially for small firms. Current bottlenecks in hiring should fade as the health conditions tied to the COVID-19 variant continue to improve, setting the stage for solid job gains in the coming months.”
And expecting those “solid job gains” to materialize sooner rather than later, J.P. Morgan strategists told clients that “we are looking for a 575,000 gain in jobs [on Oct. 8]. The driver for an above-consensus forecast is the expected rebound in the leisure and hospitality sectors.” For context, the consensus estimate is for 500,000 jobs added.
The bottom line? While the EUR/USD is finally starting to reflect fundamental reality, more downside should materialize in the coming months. With the Fed accelerating its hawkish rhetoric (and Chairman Jerome Powell’s shift the most noteworthy), the ECB is headed in the opposite direction. And while I’ve been warning for months that the Eurozone’s economic recovery is much more fragile than the U.S.’, the seeds are now sown for a profound divergence in central bank policy.
Moreover, while U.S. nonfarm payrolls may or may not accelerate the timeline on Oct. 8, it’s important to remember that the medium-term implications remain intact: the Fed should taper at a much faster pace than the ECB and the liquidity drain should pressure the FED/ECB ratio and the EUR/USD in the coming months. More importantly, though, with the EUR/USD’s pain the USD Index’s gain, the latter’s strong negative correlation with gold, silver and mining stocks should result in further downside for the PMs over the medium term.
In conclusion, the PMs were mixed once again on Oct. 6, though silver, was the worst performer of the bunch. Moreover, with the USD Index recapturing 94, and the front-end of the U.S. yield curve rallying as well, a recovering U.S. labor market should add more upward momentum to the PMs’ fundamental villains. As a result, the precious metals’ current consolidations will likely give way to sharp drawdowns in the coming months.
Thank you for reading our free analysis today. Please note that the above is just a small fraction of today’s all-encompassing Gold & Silver Trading Alert. The latter includes multiple premium details such as the targets for gold and mining stocks that could be reached in the next few weeks. If you’d like to read those premium details, we have good news for you. As soon as you sign up for our free gold newsletter, you’ll get a free 7-day no-obligation trial access to our premium Gold & Silver Trading Alerts. It’s really free – sign up today.
Thank you.
Przemyslaw Radomski, CFA
Founder, Editor-in-chief
Tools for Effective Gold & Silver Investments - SunshineProfits.com
Tools für Effektives Gold- und Silber-Investment - SunshineProfits.DE
* * * * *
About Sunshine Profits
Sunshine Profits enables anyone to forecast market changes with a level of accuracy that was once only available to closed-door institutions. It provides free trial access to its best investment tools (including lists of best gold stocks and best silver stocks), proprietary gold & silver indicators, buy & sell signals, weekly newsletter, and more. Seeing is believing.
Disclaimer
All essays, research and information found above represent analyses and opinions of Przemyslaw Radomski, CFA and Sunshine Profits' associates only. As such, it may prove wrong and be a subject to change without notice. Opinions and analyses were based on data available to authors of respective essays at the time of writing. Although the information provided above is based on careful research and sources that are believed to be accurate, Przemyslaw Radomski, CFA and his associates do not guarantee the accuracy or thoroughness of the data or information reported. The opinions published above are neither an offer nor a recommendation to purchase or sell any securities. Mr. Radomski is not a Registered Securities Advisor. By reading Przemyslaw Radomski's, CFA reports you fully agree that he will not be held responsible or liable for any decisions you make regarding any information provided in these reports. Investing, trading and speculation in any financial markets may involve high risk of loss. Przemyslaw Radomski, CFA, Sunshine Profits' employees and affiliates as well as members of their families may have a short or long position in any securities, including those mentioned in any of the reports or essays, and may make additional purchases and/or sales of those securities without notice.
Przemyslaw Radomski Archive |
© 2005-2022 http://www.MarketOracle.co.uk - The Market Oracle is a FREE Daily Financial Markets Analysis & Forecasting online publication.