


UK House Prices Trend Forecast 2022 to 2025
Housing-Market / UK Housing Jul 12, 2022 - 08:22 PM GMTBy: Nadeem_Walayat

This is the 3rd and final part of my extensive analysis of the UK housing market that concludes in a detailed 3 year trend forecast for UK house prices ( Part 1, Part 2 )
UK House Prices Trend Forecast 2022 to 2025
THE INFLATION MEGA-TREND
WE HAVE NO CHOICE BUT TO INVEST IN STOCKS AND HOUSING
High Inflation Forecast for Whole of this Decade Due to Rampant Money Printing
Fed Inflation Strategy Revealed
Russian Sanctions Stagflation Driver
RECESSION RISKS 2023
UK Debt Inflation Smoking Gun
Britains' Hyper Housing Market
UK Population Growth Forecast 2010 to 2030
UK House Building and Population Growth Analysis
UK Over Crowding Ratio
Overcrowding Implications for UK House Prices
UK Housing Market Affordability
UK House Prices Real Terms Sustainable Trend
UK House Prices Relative to GDP Growth
UK House Prices Momentum Forecast
UK House Prices and the Inflation Mega-trend
Lets Get Jiggy With UK INTEREST RATES
Is the US Yield Curve Inversion Broken?
UK house Prices and Yield Curve Inversions
Interest Rates How High WIll they Go?
Work From Home Inflationary BOOM?
Formulating a UK House Prices Forecast
UK House Prices 2022 to 2025 Trend Forecast Conclusion
Peering into the Mists of TIme
Risks to the Forecasts
US House Prices Trend Forecast 2022-2024
The whole of this analysis was first made available to patrons who support my work.So for immediate first access to ALL of my analysis and trend forecasts then do consider becoming a Patron by supporting my work for just $4 per month. https://www.patreon.com/Nadeem_Walayat.
Including access to my most recent analysis -
- Stocks Bear Market Rally Last Gasp Before Earnings Season, US House Prices 3 Year Probability Range
- The REAL Stocks Bear Market of 2022
- The Psychology of Investing in a Stocks Bear Market
- Dow 2022 Stock Market Trend Pattern
Note: The information provided in this article is solely to enable you to make your own investment decisions and does not constitute a personal investment recommendation or personalised advice.
Is the US Yield Curve Inversion Broken?
The US has experienced 6 recessions over the past 40 years each of which were accompanied by an inversion of the 2 year and 10 year treasury bond yields an average of 18 months BEFORE the recession so whilst US yield curve inversions have proven to be a useful indicator in the past, though this time around inflation has been warning of a recession for a good 6 months before the US yield curve recently tentatively inverted sending MSM into a spin. Still the below chart does demonstrate that a yield curve inversion was imminent given that the interest rates have hit the down sloping trendline at which point yield curves tend to invert usually in advance of a recession which tends to typically follow 12 to 18 months after inversion, in terms of stocks and housing this implies downwards price pressure AHEAD of the recession rather than WITH the recession. But again all of the inversions of the past 20 years were during periods of LOW inflation.
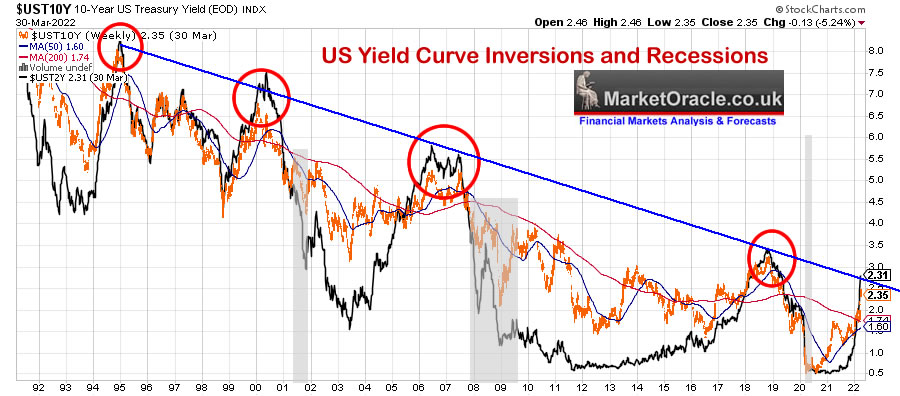
So is the US yield curve predicting lower GDP, and hence lower inflation and hence moderating house prices. HOWEVER MARKETS are a LEADING indicator i.e. stocks started falling at the start of January 2022 and not early January 2023 when the recession is likely to materialise, similar for US housing momentum that has just started fall and not when the actual recession bites.
We also have the problem of the Fed balance sheet. How can long dated bond yields be accurate when the Fed has bought trillions of bonds to suppress long-term interest rates. So ,maybe this time around things are different in that the real yield curve has NOT inverted instead the real yield is already well North of 4% inline with high inflation, of course there is no data that suggests so but that the impact of 1/3rd of US debt monetized should not be discounted.
And then we have the gaping black hole which are the budget deficits, the UK will borrow over £100 billion this year and the US over $1 trillion so ever expanding supply of printed bonds translates into ever higher bond interest rates unless the central banks keep monetizing debt which they say they are no longer going to do but let maturing bonds expire rather than be rolled over but as history demonstrates they are a bunch of lying SOB's!
Don't believe the hype QE is FOREVER!
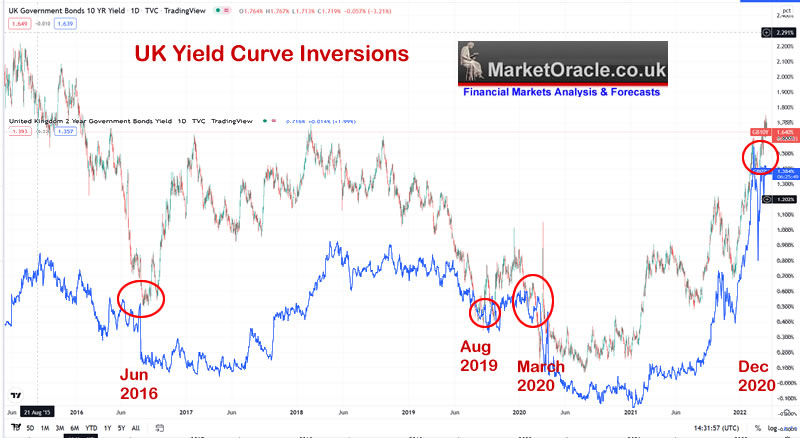
UK house Prices and Yield Curve Inversions
The Bank of England just like it's US counterpart recognises the significance of the yield curve inversions not because it has magical powers but that it tends to act as a self fulfilling prophecy, i.e. if enough people act on such as trigger as they tend to do then YES it will negatively impact on economic activity as market participants respond accordingly.
However in this respect the Bank of England has done a good smoke and mirrors job of masking the importance of yield curve inversions in the UK, which just don't carry as much weight as they do in the US. The UK yield curve has already temporarily inverted in December, but as has been the case for some time it tends to be of a con flip significance. At best UK yield curve inversions signal economic stress that we are already well aware of.
Interest Rates How High WIll they Go?
The Fed has penciled in 7 rate hikes that target 2.5% this year! Though I think 2% is more probable and thus will be nothing to cry about, so maybe 5 or 6 rate hikes in total.
What about 2023? 2.5% seems probable again that would be nothing to cry about. I would surprised if interest rates end 2023 below than 2.5% i.e. the interest rate risks are to the upside so 3% is possible if not probable at this time. Nevertheless 2% 2022, 3% 2023 will still be LOWER than CPLIE! Again Interest rates should be HIGHER than inflation! i.e. about 10% NOW! Of course that is not going to happen! But that is what normal interest rates look like!
Work From Home Inflationary BOOM? - A cut and paste job from my January 2021 US Housing Market article.
The pandemic has resulted in many tens of millions more americans working from home. As someone who has been working form home for a good 15 years I can well understand why house prices have rocketed higher as prospective home buyers both seek out properties that are better suited to working from home, more suburban, quiet office spaces, plenty of storage, or view properties with scope to being upgraded into work from home environments.

And then we have the demand for home working tech where demand has soared through the roof during 2020 and looks set to continue into the END OF 2021. Which is why I went on a personal spending spree upgrading virtually whole of my home tech whenever the opportunity presented itself i.e. Prime Day, Black Friday and Cyber Monday of which Black Friday turned out to present the best value for money discounts.
Where upgrading your homes and tech for home working is concerned then the key thing is to act sooner rather than later as there is a GREAT DEAL OF inflation in the pipeline for home working technology i.e. computers, DELAYING purchases in the hopes of price drops IS NOT GOING TO WORK. If you need a new computer then bite the bullet and buy it now because prices look set to increase during 2021! Which is something that the tech reporters don't realise as they scratch their heads and keep suggesting that stock and prices will soon start to normalise which is usually what one expects tech to do i.e. get cheaper over time. Instead the likes of the Ryzen 5000 processors and and RTX 3000 series GPU's rather than falling in price will INCREASE in price because we are in an inflationary working from home BOOM!
So make lists of what you need to efficiently work from home and then go and buy it ASAP because prices are going to go much higher during 2021!
Where the housing markets are concerned then it should not be so surprising that house prices have gone up when the consensus expectations were that they would fall, and will go up further for many homes are now also part commercial office space and thus price rises are reflecting that added value, and at some point we will probably see governments attempt to levy extra taxes onto home workers, perhaps during 2022. Conversely commercial real estate especially office space is going to experience more pain during 2021 which perhaps could present opportunities to pick up some cheap commercial office space for those seeking to expand out of their home offices.
UPDATE
The big question is if the Work from Home Boom is over? After all I have bought nothing of significance since March 2021 in terms of maximising working from home, though by design I have engineered working form home since 2012 when I bought my present home with being able to work from home in mind which I am sure continues to be driver for many would be home buyers as they seek out properties that are well suited for working from home to the detriment of office space.
Therefore if economic contraction of sorts is expected or materialises many will view that as an opportunity to move up the housing ladder with work from home in mind and thus be prepared to pay more for a house than they would if they were just seeking a home to live in , i.e. a home that generates revenues cannot be valued on the same basis as what economists still to this day rely on. So technically most UK home homes are a LOT cheaper than the metrics imply them to be something academics will come back to many years from now to explain why house prices continued to rise due to many more people choosing to work from home.

As for me I am eyeing an office space slump as an opportunity to add an office building to my existing portfolio of 2 properties. Though as with everything it all depends on price, for instance, 1 property I was looking at back in Sept\ember 2021 which appeared to be reasonably priced at £550k, soon shot higher on interest to £725,000, currently perched on £695,00 as they sellers being an estate agency decided to ramp up the price on buyer interest. So I can see from first hand experience just how difficult it is to buy a property in the UK in this climate because there is no such thing as a cheap property. All one can do is do the sums with a view to dual use work from home built in. Bring on the recession so I can snap this up for about £550k.
Work from home is the new normal.
Formulating a UK House Prices Forecast
House prices will be higher a year from now, 2 years from now and definitely 3 years from now, the question mark is how high?
Momentum suggests a flat lining market from late 2022 with very light upwards price pressure during early 2023 that could see house price inflation briefly fall towards zero accompanied by maybe a couple of down months before the bull market resumes going into 2024 and 2025.
Net immigration of 300k and an expected Ukrainian influx of at least 200k is going to put the UK housing market under extra strain and upwards price pressure.
Britain continues to hit new over crowding extremes as house building continues to fail to keep pace with population growth - so any house price falls due to a weakening economy will be muted and temporary, thus those waiting for much cheaper properties are going to be badly disappointed.
Inflation suggests we have yet to see a mania when house prices inflation exceeds 20% per annum, until that happens the bull market will continue.
House prices are likely to closely track the RPI inflation rate, so move between a range of about +5% to +10% ! Which is still pretty strong ! NO declines. Say RPI hits 10% then drifts lower to 6% per annum for a couple of years before moving higher again implies strong house price inflation.
Rampant money printing (Deficit spending) continues without abandon, $1 trillion in the US, £100 billion in the UK, I don't buy their snake oil that the central banks will reduce their balance sheets, UK debt is only going to increase and the Bank of England will keep monetizing it so QE is for EVER!
The bottom line is that UK house prices ARE expensive - BUT there is nothing to suggest that they will NOT continue to get more expensive over the coming years all the way to the next MANIA.
UK House Prices 2022 to 2025 Trend Forecast Conclusion
My expectations are for for average UK House prices (Halifax) to continue to trend higher over the next 3 years, punctuated by a brief pause during early 2023 in response to interest rate hikes, weakening economy and tax rises. However persistent high inflation, extreme over crowding and continuing strong population growth ensures that the bull market will remain in tact. Therefore my forecast conclusion is for average UK house prices (Halifax) to target a rise from £278,123 as of February 2022 over the next 3 years to £340,632 for February 2025 data (Halifax) targeting a price increase of 22.5% over 3 three years as as illustrated by my trend forecast graph below -
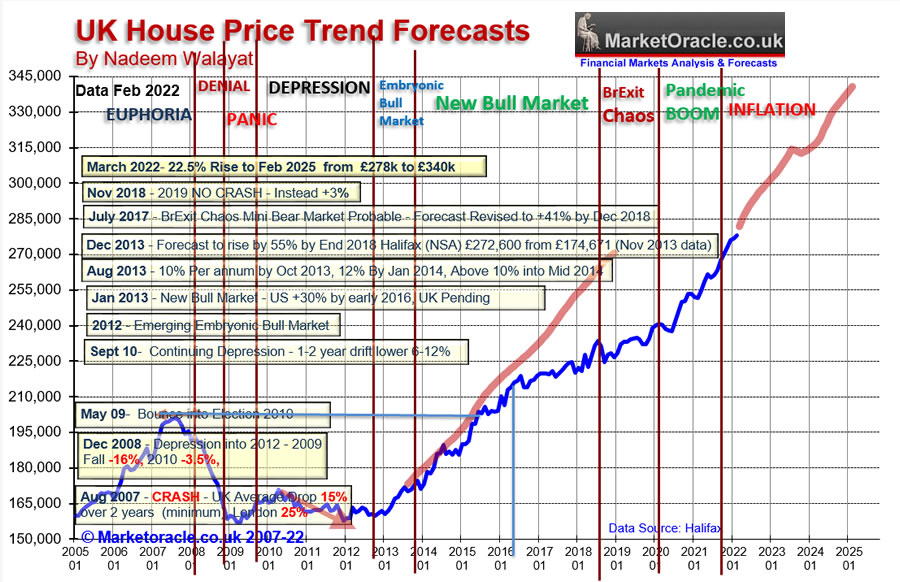
Peering into the Mists of TIme
It is highly probable that the UK housing bull market will continue trending higher beyond my three year trend forecast by posting year on year gains all the way into into 2027.
Risks to the Forecasts
Sorry if you were hoping that there is a risk that house prices could fall as the risk I see is that UK house prices enter a mania phase when house price inflation exceeds 20% per annum. However, given rising rates, slowing economy, and increasing taxes then a mania during 2022 and 2023 appears to be unlikely.
US House Prices Trend Forecast 2022-2024
My analysis and trend forecast for US house prices will follow in about 1 weeks time, but briefly - My US housing market trend forecast of January 2021 based on date Upto October 2020 (US Housing Market Trend Forecast 2021) concluded in the following trend forecast:
Therefore my forecast conclusion is for the US housing market bull market to further accelerate to an annualised momentum of just over 10% per annum during Mid 2021 before momentum slows to end 2021 with a gain of about 7.7% for the year, on top of again of 1% for November and December 2020. For a total house prices gain of about 9% by the end of 2021. i.e. Case Shiller 10 city Index (SPCS10RNSA ) rising from 248.5 (Oct 2020 data) to 271 (Dec 2021 data) as illustrated by my trend forecast graph.
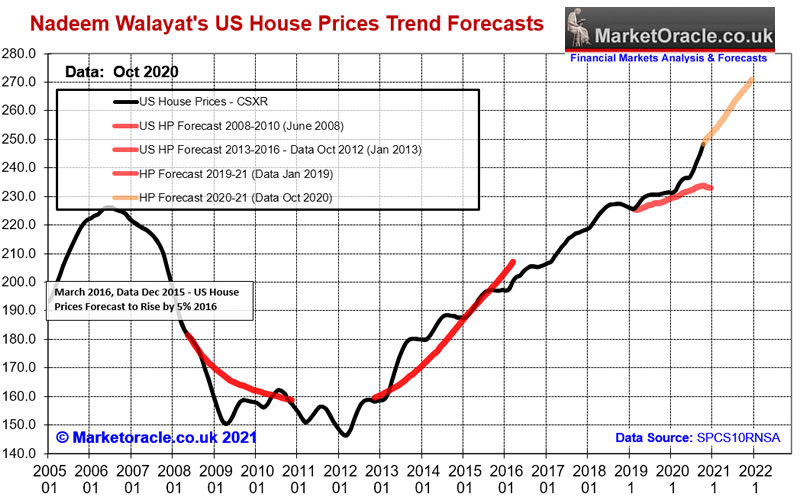
The updated graph shows we had a spectacular bull run courtesy of continuing Fed rampant money printing.
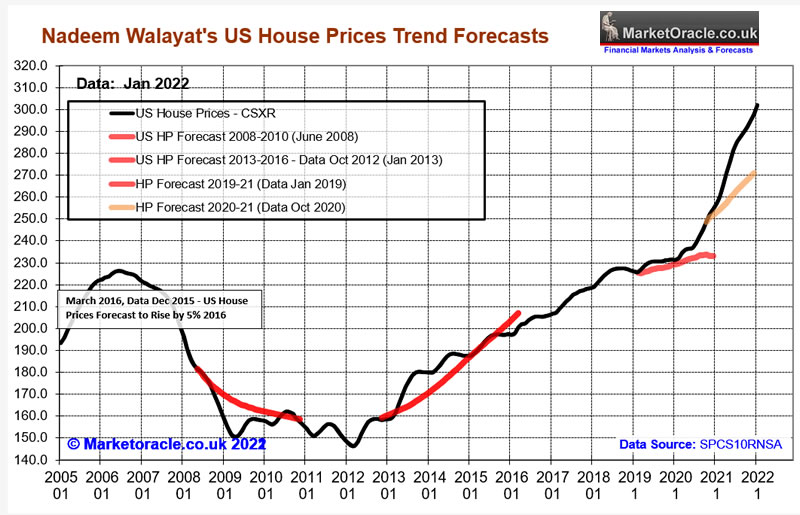
As for where US house prices are headed next well US house prices are RED HOT galloping ahead at near 20% per annum which is unsustainable which means momentum will significantly moderate over the coming months. so expect a sharp slowdown in US house price inflation.
US House prices 3 year trend probability was covered in my most recent analysis analysis - Stocks Bear Market Rally Last Gasp Before Earnings Season, US House Prices 3 Year Probability Range
Again the whole of my extensive US housing market analysis was first made available to Patrons who support my work. So for immediate first access to ALL of my analysis and trend forecasts then do consider becoming a Patron by supporting my work for just $4 per month. https://www.patreon.com/Nadeem_Walayat.
Including access to my recent analysis -
- Stocks Bear Market Rally Last Gasp Before Earnings Season, US House Prices 3 Year Probability Range
- The REAL Stocks Bear Market of 2022
- The Psychology of Investing in a Stocks Bear Market
- Dow 2022 Stock Market Trend Pattern
My Main Analysis Schedule
- UK House Prices Trend Forecast - Complete
- US House Prices Trend Forecast - 90%
- Global Housing / Investing Markets - 60%
- Stock Market Trend forecast into End 2022 - 0%
- US Dollar / British Pound Trend Forecasts - 0%
- High Risk Stocks Update - Health / Biotech Focus - 0%
- How to Get Rich - 85%

- Gold and Silver Analysis - 0%
And ensure you are subscribed to my ALWAYS FREE newsletter for my next in-depth analysis.
Your analyst contemplating a trip down to New Zealand.
By Nadeem Walayat
Copyright © 2005-2022 Marketoracle.co.uk (Market Oracle Ltd). All rights reserved.
Nadeem Walayat has over 30 years experience of trading derivatives, portfolio management and analysing the financial markets, including one of few who both anticipated and Beat the 1987 Crash. Nadeem's forward looking analysis focuses on UK inflation, economy, interest rates and housing market. He is the author of five ebook's in the The Inflation Mega-Trend and Stocks Stealth Bull Market series that can be downloaded for Free.


 Nadeem is the Editor of The Market Oracle, a FREE Daily Financial Markets Analysis & Forecasting online publication that presents in-depth analysis from over 1000 experienced analysts on a range of views of the probable direction of the financial markets, thus enabling our readers to arrive at an informed opinion on future market direction. http://www.marketoracle.co.uk
Disclaimer: The above is a matter of opinion provided for general information purposes only and is not intended as investment advice. Information and analysis above are derived from sources and utilising methods believed to be reliable, but we cannot accept responsibility for any trading losses you may incur as a result of this analysis. Individuals should consult with their personal financial advisors before engaging in any trading activities.
Nadeem Walayat Archive |
© 2005-2022 http://www.MarketOracle.co.uk - The Market Oracle is a FREE Daily Financial Markets Analysis & Forecasting online publication.