


Beware of This Deceptive Stocks Bear-Market Trait
Stock-Markets / Stocks Bear Market Sep 01, 2022 - 02:20 PM GMTBy: EWI

There's only one rule which applies to a 2nd wave rally...
Big stock market trends don't progress up or down in a straight line. In a bear market, stocks typically rebound after the first leg down. In a bull market, the opposite happens: Stocks again take a big dive, making everyone think the bear market has returned.
But in a bear market, that "first leg down" is wave 1 and the partial "rebound" which follows is wave 2. I say "partial" because the only rule which applies to wave 2 is that it cannot retrace 100% of wave 1. Meaning, the bear market rally cannot go above the previous market top.
That said, the percentage of these retracements can be quite high. Let's look at a couple of historical Dow Industrials' examples, starting with 1968-69:
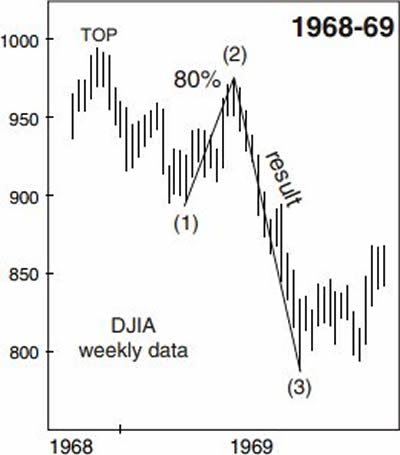
As you can see, the wave 2 rebound retraced 80% of the wave 1 decline. The last thing many investors expected was the portfolio-crushing wave 3 which followed.
This next chart shows that the percentage of the wave 2 retracement during the 1937-38 bear market was even higher:
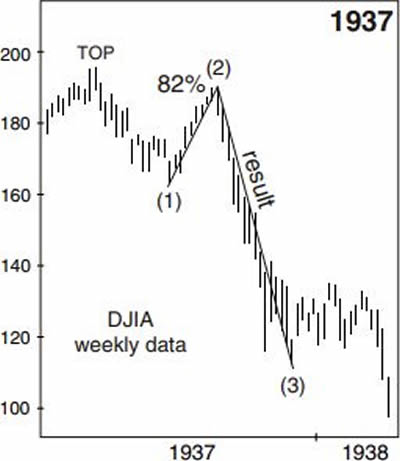
Following wave 2, wave 3 brought a 41% decline in just three months. Parenthetically, by the time wave 5 was complete, the Dow Industrials had dropped 49% from the wave 2 high.
Be aware that a key characteristic of wave 2 during a bear market is that the bullish psychology is usually just as intense -- or even more so -- than what was displayed at the top of the prior bull market. Many investors believe the first drop in the bear market created "bargains" and scoop them up.
Is the same pattern of investor psychology playing out here in 2022? Here are some recent headlines:
- Bank of America, Disney, and Uber All Look Like Bargains (Barron's, August 8)
- [Managing Director] makes his case for S&P to reach 4,800 by year end (CNBC, August 5)
- Investors Spot Bargains Among Small-Cap Stocks (Wall Street Journal, June 1)
The bullish sentiment expressed in these headlines might turn out to be correct.
On the other hand, we do know that the U.S. stock market top occurred in January, and after an initial leg down, the market staged a significant rebound.
If a devastating wave 3 down is next, the remainder of the bear market may be far more devastating than what was shown in the two historical examples.
That's what the Elliott wave model is suggesting. Do keep in mind that no method of market analysis provides a guarantee about a financial market's future price path. That said, this is an ideal juncture at which to learn about Elliott wave analysis if you're unfamiliar with it.
The definitive text on the subject is Frost & Prechter's Elliott Wave Principle: Key to Market Behavior. Here's a quote from this Wall Street classic:
In the 1930s, Ralph Nelson Elliott discovered that stock market prices trend and reverse in recognizable patterns. The patterns he discerned are repetitive in form but not necessarily in time or amplitude. Elliott isolated five such patterns, or "waves," that recur in market price data. He named, defined and illustrated these patterns and their variations. He then described how they link together to form larger versions of themselves, how they in turn link to form the same patterns of the next larger size, and so on, producing a structured progression. He called this phenomenon The Wave Principle.
Although it is the best forecasting tool in existence, the Wave Principle is not primarily a forecasting tool; it is a detailed description of how markets behave.
Here's the good news: You can read the entire online version of the book for free once you become a member of Club EWI, the world's largest Elliott wave educational community.
You can join Club EWI for free and you may be interested in knowing that members enjoy complimentary access to a wealth of Elliott wave resources on financial markets, investing and trading. These resources include articles and videos from Elliott Wave International's analysts. Also know that you are under no obligation as a Club EWI member.
Hop aboard now and enjoy free access to Elliott Wave Principle: Key to Market Behavior (just follow the link).
This article was syndicated by Elliott Wave International and was originally published under the headline Beware of This Deceptive Bear-Market Trait. EWI is the world's largest market forecasting firm. Its staff of full-time analysts led by Chartered Market Technician Robert Prechter provides 24-hour-a-day market analysis to institutional and private investors around the world.
© 2005-2022 http://www.MarketOracle.co.uk - The Market Oracle is a FREE Daily Financial Markets Analysis & Forecasting online publication.