Dow Stock Market Trend Forecast to December 2023
Stock-Markets / Stock Market 2023 Dec 31, 2022 - 11:44 PM GMTBy: Nadeem_Walayat
Dear Reader
What if someone told you where the Dow stocks index will be trading at in 3 months time and by that time the index was within 1% of where it was forecast it would be. How much would you value such analysis, furthermore without the benefit of hindsight that forecast did not just end there but continued on for a further whole year, what's that worth? Given that many so called analysts can't even go beyond a trading day.
Well that is what you are going to be in receipt of in this the final part of my 6 part series that concludes in a detailed Dow stock market trend forecast into the end of 2023 which my Patrons gained access to on 5th October 2022, that forecast that the Dow by now would be trading at 32,850 against actual last close of 33,147 (30th of December 2022), which represents a less than 1% deviation against the trend forecast.
That is the beauty of trend forecasts as they represent the sum of ones analysis at a fixed point in time and thus there is NO HINDSIGHT which is what one gets from the reeds that blow in the wind analysts, flip flopping between bull and bear depending on whether the market is up or down that day. They do this because it is infinitely EASIER to look in the rear view mirror and explain what has already happened then to to even attempt to clear away the mists of time in terms of trying to deduce that which is most probable, weeks, months even over a year into the future, which to say the least is NOT easy but still that is what I seek and undertake in my analysis and concluding trend forecasts, so for immediate first access to ALL of my analysis and trend forecasts then do consider becoming a Patron by supporting my work for just $4 per month, which is soon set to rise to $5 per month for new signup's so lock in now at $4 per month, which is nothing, for instance if someone did what I do then I would gladly pay them 4 bucks a month to be in receipt of all that I do! https://www.patreon.com/Nadeem_Walayat.
PART ONE: Stock Market Trend Forecast October 2022 to December 2023
Keep Calm and Carry on Buying Quantum AI Tech Stocks
Stock Market AI mega-trend Big Picture
Stock Market 2022 Trend Current Expectations Review
Feeding the Beast
Quantum AI Tech Stocks Portfolio
STOCK MARKET DISCOUNTING EVENTS BIG PICTURE
US Economy and Stock Market Addicted to Deficit Spending
The Inflation Mega-trend
US Economy Has Been in an Economic Depression Since 2008
WHY PEAK INFLATION RED HERRING
US interest Rates and Inflation
Inflation and Interest rates Implications for the Stock Market
TIPS BONDS INFLATION PROTECTION
FED Balance Sheet
SMASHED Bond Market Brewing Opportunity
Stocks and Inverted Yield Curve
US Dollar Big Picture
US Dollar Strength Implications for Global Economies
Financial Crisis 2.0 and Interest Rates
UK Economy and British Pound Trend Forecast
RECESSIONS 2023
The Stock Market Recession Pattern
PART TWO: Stock Market Trend Forecast October 2022 to December 2023
Will there be an Early Fed Pivot?
Why Most Stocks May Go Nowhere for the Next 10 Years!
Valuation Reset and Future EPS
Margin Debt
Answering the Question - Has the Stocks Bear Market Bottomed?
Stock Market Breadth
Stock Market Investor Sentiment
Dow Short-term Trend Analysis
Dow Long-term Trend Analysis
ELLIOTT WAVES
Dow Annual Percent Change
Stock Market Volatility (VIX)
Stocks and 10 Year Bond Yields
SEASONAL ANALYSIS
Correlating Seasonal Swings
Major Market lows by Calendar Month
US Presidential Cycle
Best Time of Year to Invest in Stocks
Formulating a Stock Market Trend Forecast
Dow Stock Market Trend Forecast September 2022 to December 2023
Most recent analysis includes -
- S&P500, Gold, Silver and Crypto's Trend Forecasts 2023
- Santa Battles Grinch to Deliver Stock Market Last Gasp Rally into the New Year
- Santa Sledge on the Launch Pad for Stock Market Post CPI To the Moon Rally
- Stocks Analysis Bonanza - GOOG, QCOM, ASML, TCHEY, BABA, BIDU, TSLA, WDC, RBLX, MGNI, COIN, BITCOIN CAPITULATION!
SEASONAL ANALYSIS
The seasonal pattern suggests after a pause in Feb, higher into late April, then correct from early May into late June followed by a volatile summer terminating in a swing low during September that should set the scene for a bull run into the Christmas Holidays with of course intra month volatility during October that resolve to the upside just as the perma-bears are crowing at their loudest that the end is neigh.
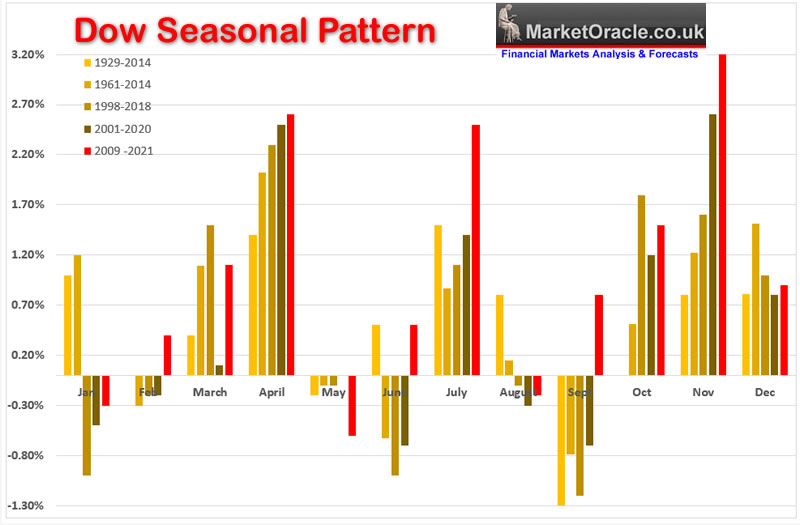
As we have a bear market thus it is a case of SWINGS rather than TREND i.e. we had a down swing into early March, rally into Mid April, a down swing into Mid June and then a strong rally into Mid August, i.e. July was strongly higher, and then down hard into the September low. So seasonal analysis in hindsight looks remarkably accurate for 2022! Hindsight! Going forward (without hindsight) October and November should see the stock market go UP, December is still up but weaker, so suggest a peak into Christmas and down into the end of the year. So Seasonal analysis suggests that despite a volatile October after all the S&P just closed at 3585! Putting my neck on the chopping block to say Friday is the bottom! Nevertheless, October strongly higher, November strongly higher, December weakly higher.
As for 2023, a December peak sets the scene for a correction into February, rally into late April / Early May. Summer is going to be volatile with a downwards bias, probably all the way into early October, so maybe a mini bear market from Early May to early October, weak not on the scale of 2022., and then a powerful bull run into the end of the year for a strong up year.
Correlating Seasonal Swings
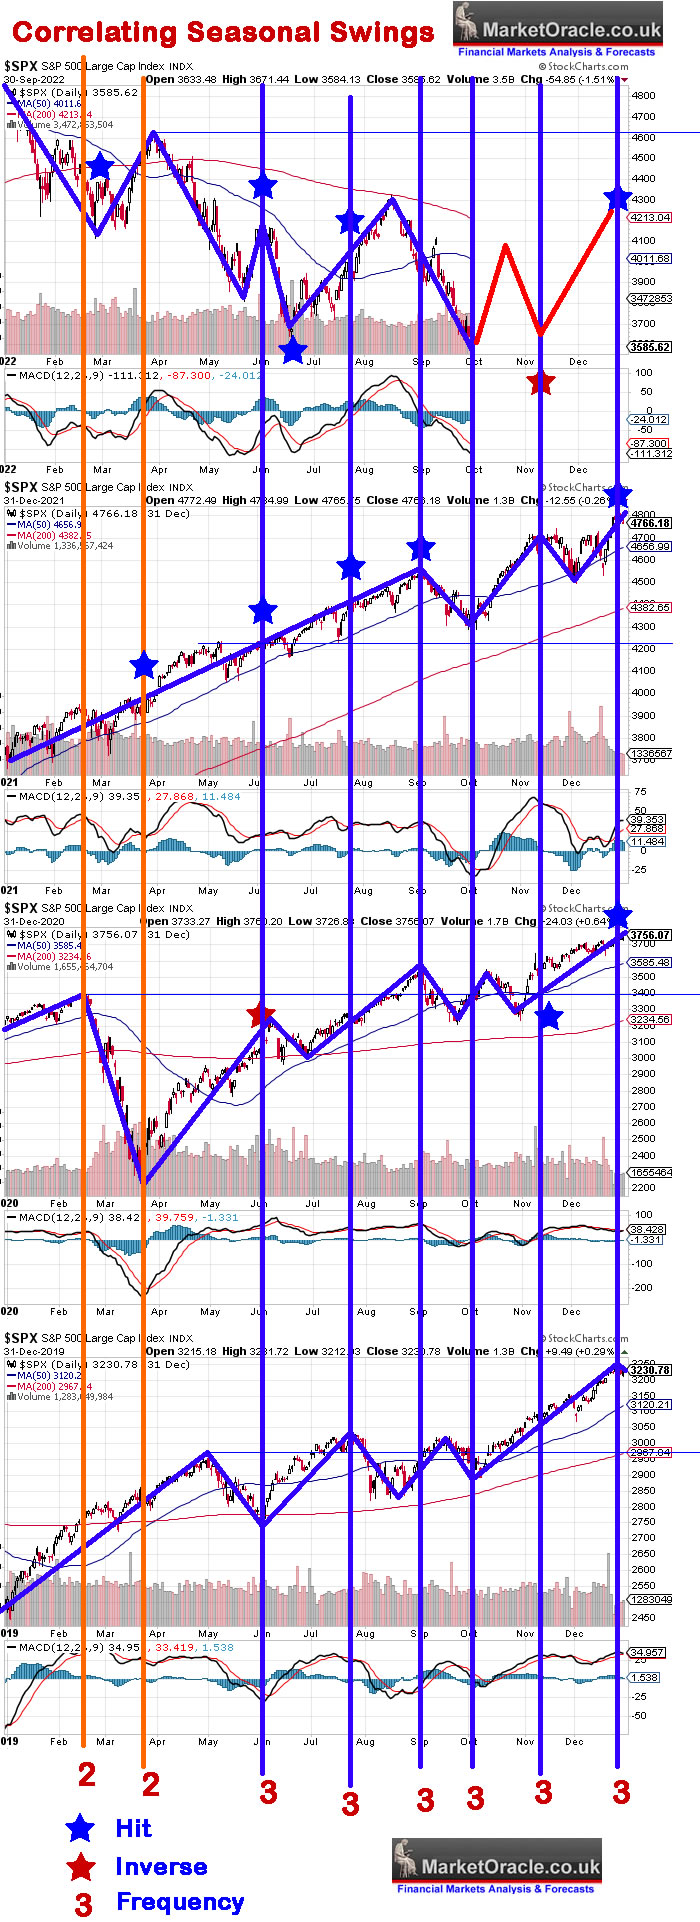
Not satisfied with seasonal swings I've continued last years near term years seasonal analysis by comparing the year on year change which suggests that the market IS at BOTTOM and thus due a rally into Mid October for a higher low retest into early November, though October should end higher than where it began, where an early November low sets the scene for a powerful rally into at at least Christmas, 2023 bull into September, down into October start.
Major Market lows by Calendar Month
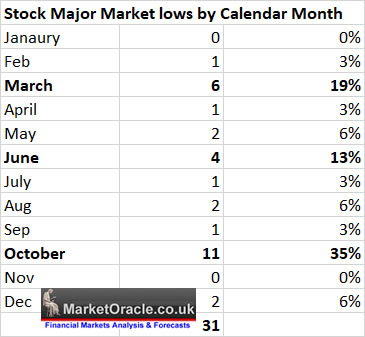
Some 80 years of stock market history resolves in the following table for when major stock market lows tend to occur, as one can see there are three clusters, March, June, and October, which is another reason why I thought that the June low was highly probably THE LOW. But now we have SEPTEMBER, we made a NEW Low in September which is not probable, and therefore despite Monday's rally it looks like we will trade to a new low during October albeit a marginally lower low foe that is what this table implies. The Dow currently stands at 29490, barely 2.7% above it's bear market low, so yes sitting where we are the stock market looks set to make a new low in October and thus comply with what this table strongly suggests should happen, else September becomes an outlier new low, for which there is an approx 10% chance.
US Presidential Cycle
This is what I concluded a year ago in my September 2021 analysis -
So the election year cycle favours a strong up year as Uncle Biden prints plenty of dollars for everyone to party, which is basically what we are experiencing. Though next year that Democrat performance slumps to just +0.6%! Which suggests this rally is a time to take profits and de risk, because 2022 according to the Presidential cycle could be weak!
So far so good, what next? Well for 8 straight decades stock market indices such as the Dow and S&P have headed higher after the ,mid-terms with the average gain being 15%.
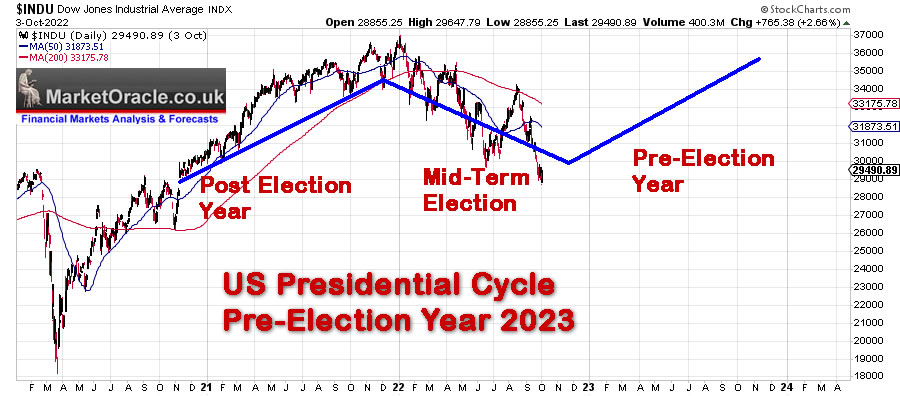
That is a 100% probability that stocks will be higher than where they end in October. Whilst the average gain is 15%, the spread tends to be quite large in the range of +10% to +15% which therefore suggests that 2023 will be an up year for stocks. In fact we could see a powerful pre-emptive rally ahead of the Mid-terms from the current state of extreme pessimism. as illustrated by the MACD and sentiment indicator,
Best Time of Year to Invest in Stocks
Statistically the best time of year to buy Stocks is during late October and then hold all the way through to the end of April, for an early May top, whilst the subsequent 6 months tend to be the weakest of the year. What happened this year ?
The Dow ended October 2021 at about 35,750, and traded to a 2022 high of 34,100 early May, which is down 5%. Obviously with the signs of a bear market brewing one would be vary of this pattern for this year. Whilst the subsequent 6 months have turned out to be WEAK, down 18% from early May so at least that part came true. However it is probable that 2023 will see the Buy October Sell in May pattern come good to some degree.
Formulating a Stock Market Trend Forecast
The character of this bear market has been changing since the June low, first came the break above 33.3k into the August FOMO peak. and then came the decline to 28.7k that whilst a new bear market low was weak in trend channel terms.
so what is going on?
ACCUMULATION is what's going on, Accumulating since the June low. It should be fairly obvious that there is a lot of buying gone on and market manipulation so as to allow it to happen. It's as though the wolfs of wall street are leading the retail investor lambs to slaughter as the retail crowd are dealt hammer blows in either direction aimed at fleecing them of their wealth.
The smart money is accumulating! All whilst MSM and the blogosfear literally paint a perpetual picture of DOOM and FEAR that they STILL sustain despite what we witnessed earlier this week! INVESTORS have been conditioned to expect the likes of S&P 3200 as a done deal, when the reality is NOTHING is a done deal!
Furthermore even thought the purpose of this analysis is to conclude in a Dow trend forecast, I consider the indices to be a red herring, as it's all about the stocks! Many great stocks are trading at huge discounts to the indices for instance Qualcom on a PE of 10! AMD 17, TSMC 14, AMAT 11, Micron 6, Lam Research 12 and so on. This is what investing is all about, identifying good stocks and accumulating them when they are cheap, the indices are a side show, but they remain the focus of most.
Having scoured this analysis a dozen times what sticks out the most in terms of weighting are
1. that valuations HAVE moderated and will continue to do so. So gone are the ridiculous P/E's of late 2021.
2. A recession is brewing, due to hit the US during the 2nd half of 2023 in advance of which the Fed will have completed it's rate hikes to probably well below the markets worst expectations i.e. they may not even make it to 4%.
3. This is not really a bear market, to me it does not feel like a bear market. Where is the PANIC? Okay so the uK did panic, but the decline in the indices has been orderly. The swings are orderly, muted even as though engineered, this is evident by the failure of the VIX to spike instead unnaturally has remained range bound.
4. Bond markets have done their worst and look like they are bottoming..
5. Seasonal analysis and the Presidential election cycle are painting a compelling picture for a strong 2023. After all a strong down year tends to be followed by a strong up year.
Dow Stock Market Trend Forecast September 2022 to December 2023
Therefore my forecast conclusion is that the bear market has likely bottomed at the end of September, and that the Dow is likely to trend higher into Mid 2023, punctuated by the usual corrections most notable of which will be at the start of the new year as the Dow fails to break above the 34.3k high which would send the Dow significantly lower to at least 31,500 in advance of it's next leg higher into June 2023 towards a target of 35,000 beyond which the Dow will face the head winds from contracting earnings as the recession starts to bite that I expect will send the Dow lower that will be followed by shrill cries that the Bear market has resumed, which given that the Dow will have made a lower high is possible, , I expect this mini bear run to terminate during October in region of the Q1 low so around 31.500 that will set the scene for a rally into the end of the year, that I suspect will not be able to break above the earlier summer highs. Still the Dow should end of the year up about 5% and some 17% from the last close of 29490 as illustrated by my trend forecast graph.
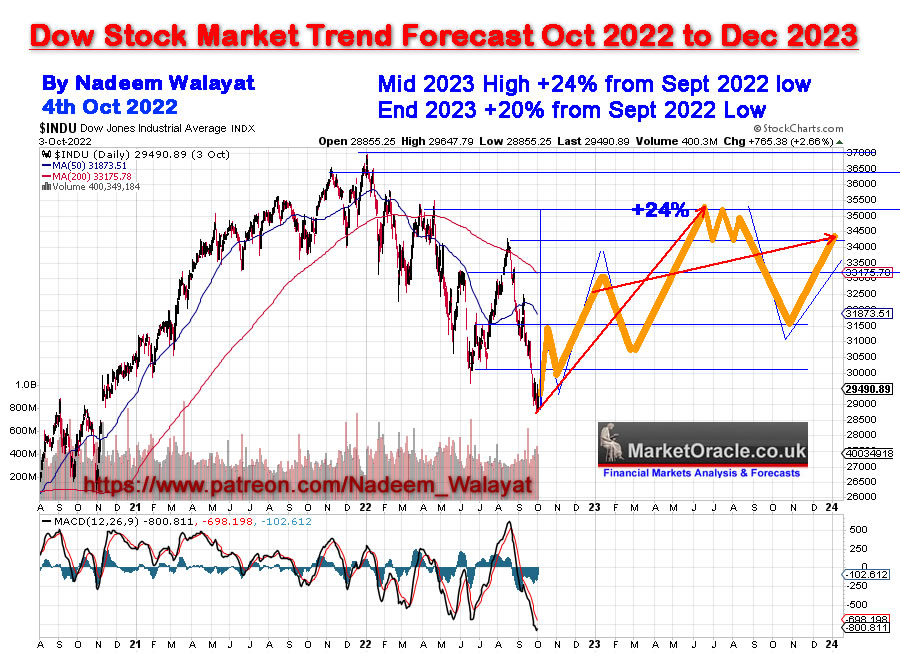
31st December 2022
Here's how the Dow trend has played out since my analysis and concluding trend forecast was posted at a time of maximum uncertainty when expectations were rife of S&P 3200 and lower (still are!).
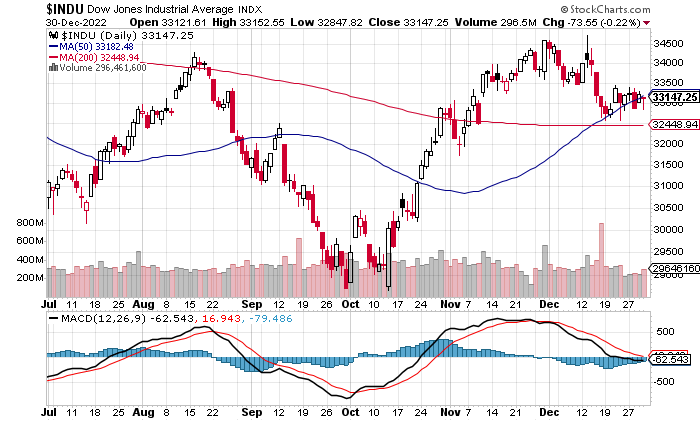
The trend forecast for where the Dow should be trading by now is 32850, the Dow's last close is 33,147, a less than 1% deviation against the forecast.
My most recent analysis covers what I expect for Gold, Silver, and Crypto markets during 2023, and also includes an S&P500 trend forecast.
Most recent analysis includes -
- S&P500, Gold, Silver and Crypto's Trend Forecasts 2023
- Santa Battles Grinch to Deliver Stock Market Last Gasp Rally into the New Year
- Santa Sledge on the Launch Pad for Stock Market Post CPI To the Moon Rally
- Stocks Analysis Bonanza - GOOG, QCOM, ASML, TCHEY, BABA, BIDU, TSLA, WDC, RBLX, MGNI, COIN, BITCOIN CAPITULATION!
For immediate first access to to all of my analysis and trend forecasts then do consider becoming a Patron by supporting my work for just $4 per month. https://www.patreon.com/Nadeem_Walayat. Lock it in now as $4 per month as this rises to $5 per month in the new year.
Apart form regular AI Tech stocks and stock market updates, my schedule includes:
- US House Prices Trend Forecast - 80%
- Global Housing / Investing Markets - 50%
- US Dollar / British Pound Trend Forecasts - 0%
- High Risk Stocks Update - Health / Biotech Focus - 0%
- State of the Crypto Markets
Again for immediate access to all my work do consider becoming a Patron by supporting my work for just $4 per month. https://www.patreon.com/Nadeem_Walayat. Lock in now as this soon increases to $5 per month for new signup's.
And ensure you are subscribed to my ALWAYS FREE newsletter for my next in-depth analysis.
Your analyst once more putting his neck on the chopping block.
By Nadeem Walayat
Copyright © 2005-2022 Marketoracle.co.uk (Market Oracle Ltd). All rights reserved.
Nadeem Walayat has over 30 years experience of trading derivatives, portfolio management and analysing the financial markets, including one of few who both anticipated and Beat the 1987 Crash. Nadeem's forward looking analysis focuses on UK inflation, economy, interest rates and housing market. He is the author of five ebook's in the The Inflation Mega-Trend and Stocks Stealth Bull Market series that can be downloaded for Free.
 Nadeem is the Editor of The Market Oracle, a FREE Daily Financial Markets Analysis & Forecasting online publication that presents in-depth analysis from over 1000 experienced analysts on a range of views of the probable direction of the financial markets, thus enabling our readers to arrive at an informed opinion on future market direction. http://www.marketoracle.co.uk
Disclaimer: The above is a matter of opinion provided for general information purposes only and is not intended as investment advice. Information and analysis above are derived from sources and utilising methods believed to be reliable, but we cannot accept responsibility for any trading losses you may incur as a result of this analysis. Individuals should consult with their personal financial advisors before engaging in any trading activities.
Nadeem Walayat Archive |
© 2005-2022 http://www.MarketOracle.co.uk - The Market Oracle is a FREE Daily Financial Markets Analysis & Forecasting online publication.


