


Overview of Cycles Analysis and a Brief Application to Crude Oil
InvestorEducation / Cycles Analysis Apr 15, 2007 - 08:35 PM GMTBy: Tim_Wood

From a cyclical perspective, the trend is defined by the direction of the cycle of the next larger degree. This means that from a cyclical perspective we work in many different dimensions. The key is to isolate and study each cycle of each dimension so that the direction and expectation of these cycles can be known. The identification of these cycle lows is definitely outside of the scope of this brief overview, as it would take volumes of material to do this subject justice.
I use a number of indicators to aid in identifying cycle tops and bottoms, but the best indicator I have found for this is my Cycle Turn Indicator. Anyway, all I want to do here is simply present the concept of using cycle highs and lows of various degrees to show you the concept of how we can work in the various dimensions to identify important turn points.
Long-Term Cycles
The first dimension that I work in is the long-term. Please see the diagram below. The red trend lines are representative of the long-term cycle. The overall trend is obviously up when this cycle is advancing and is down when this cycle is declining. These lows are identified using timing bands that have been developed through historical norms, the price action of each cycle of smaller degree and the help of price oscillators, mainly my Cycle Turn Indicator. Once a long-term cycle low is identified and confirmed, we then know that the trend is up. We can then use the declines into the lows of the cycles of smaller degree as buying opportunities. The opposite would of course be applicable when the long-term is moving down.
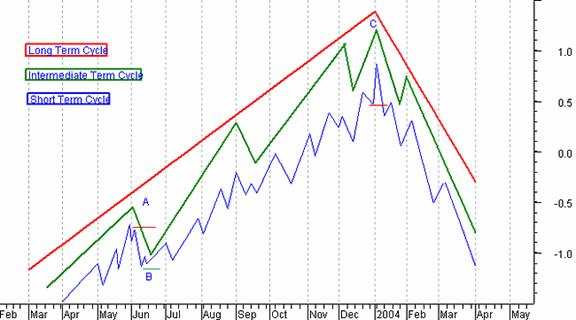
Intermediate-Term Cycles
The second dimension in this example is the intermediate-term. This is represented by the green trend lines in the diagram above. We also have timing bands or windows in which the next low should occur. These timing bands are again developed and are based on the historical averages of the previous cycles of the same degree. This in effect gives us a time target from which to expect the next low. As this intermediate term cycle advances, we then monitor the price action of the short-term cycle, represented in blue, in order to identify possible tops and bottoms.
Short-Term Cycles
The third dimension in this example is the short-term. This is represented by the blue trend lines in the diagram above. When working with the short-term cycles, there are also statistical based timing bands to help identify the time target for the next corrective move down. Notice that as this cycle moves up, each short-term cycle low is higher than the previous low. Also notice how each high is generally higher than the previous high. As long as this pattern holds, the trend is clearly up.
How The Three Dimensions Work Together
Notice at the first intermediate-term cycle top, labeled “ A ,” that the last short-term cycle failed to move above the previous short-term cycle high. I marked this event with a small red line. This setup is what I call a failure. Then, once the short-term cycle began to move down, notice that the previous short-term low was violated. This violation then serves as price confirmation that the intermediate-term cycle has topped. Therefore, the intermediate-term trend then turned down.
As a cycles analyst, I then look for the price action to continue down into the timing window for the next intermediate-term low. The price action of the short-term cycle is continuously monitored as the intermediate-term cycle moves down. I then use the combination of the timing window for the intermediate-term cycle low, the price action of the short-term cycle and my Cycle Turn Indicator to identify the next intermediate-term low.
Notice that at the intermediate-term low, labeled “ B, ” the short-term cycle makes a low above the previous low. This is sort of a failure in reverse, as price failed to make a lower low and was then followed by a higher high . This higher high is the final price confirmation that the intermediate-term trend has turned back up. At that point one can re-enter the long side or add to existing long positions as the long-term trend continues to advance. This analytical process is then repeated for the next intermediate-term cycle.
Let's now jump to the last intermediate-term advance. Notice how the intermediate-term cycle advance, labeled “ C, ” was brief in this example. Also, notice how the short-term cycle went parabolic into the final high. In this case, there was no warning by the formation of a failed short-term cycle. However, in this case the cycles analyst would have known that the advance was running on borrowed time as his timing bands for the cycle top would have warned that the top was near. Then when the short-term cycle went parabolic, he should have been further warned that the end was near for this cycle. However, in this example there was absolutely no cyclical deterioration until price fell below the previous short-term cycle low.
This event is marked with a small red line. Once the violation of the previous short-term low occurred, the cycles analyst has seen the long-term cycle move into its timing window for a top. Additionally, the short-term cycle has violated the previous short-term cycle low indicting that the intermediate-term cycle has topped and the price oscillators should at this point be warning of imminent danger. Then, with the break of the intermediate-term cycle below the previous intermediate-term cycle low, the confirmation is given that the long-term cycle has topped. Therefore, the turn in the long-term direction of the market has just occurred and that direction is now down. Once the long-term direction turns down, we can expect to see both the intermediate-term and the short-term cycles make lower lows and lower highs until the long-term cycle low is reached.
Please understand that this is a VERY simple example of how I incorporate cycles into my overall technical analysis of the markets. Also please understand that this very simple diagram is an idealized example. In the real world no technical or fundamental approach is full proof. However, this is an approach that I have found to work. All we have to do is follow the Cycle Turn Indicator and work within the statistical based timing windows for price lows.
In my work with cycles I also use statistical analysis of the long and intermediate-term cycles to develop expectations that can be applied to future cycles. For example, history may show me that 89% of all long-term cycles, that advance for 6 months or more, hold above their previous long-term low as the correction into the next long-term low occurs. Further analysis of these long-term cycles with advances of 6 months or more is then done in order to find the average advance of this group of cycles. The same is done for the declines into the lows. Analysis of the long-term cycle may also reveal that when this cycle advances for 5 months or less, the previous cycle low has an 83% probability of declining below its previous low and that the average decline is say 39%. These numbers above are all arbitrary, but I present them to you as an example of just how the quantification of cyclical behavior can be used as a guide for future cycles. The key is to identify the cycle of each degree or dimension and then apply the historical norms to the cycle. Basically, this is nothing more than cycle profiling just as a detective does criminal profiling.
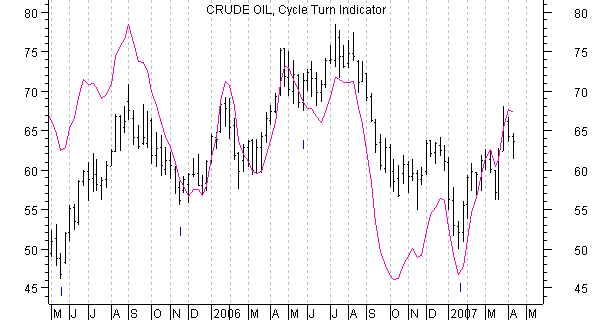
To show you a real time example of the intermediate-term cycle and the Cycle Turn Indicator I have included a current weekly chart of crude oil below. The intermediate-term cycle lows are marked with an “I” and you can see how the Cycle Turn Indicator guides us as oil moves into the tops and bottoms. Note that crude oil closed the week ending April 13, 2007 with the Intermediate-term Cycle Turn Indicator negative.
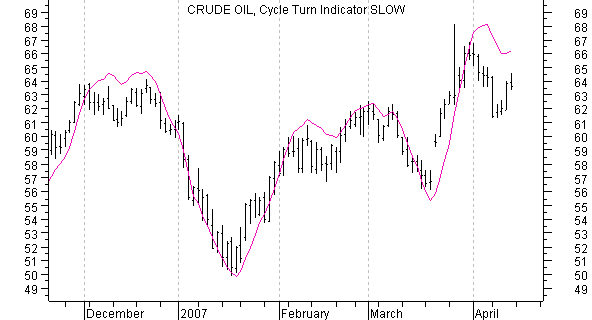
In the next chart below I have included a shorter-term daily chart along with my Cycle Turn Indicator. You can see here that the Cycle Turn Indicator does a good job of confirming the shorter-term cycles that ebb and flow at this level on the daily chart. Note that the daily Cycle Turn Indicator finished the week on a positive note, which is indicative of the shorter-term cycle low. The key now is whether the advance up out of this short-term low can turn the intermediate-term Cycle Turn Indicator back up. If so, then I would certainly look for still higher oil prices. But, should another short-term sell signal occur before the intermediate-term Cycle Turn Indicator turns back up, then at that point, much lower oil prices would be expected.
I have found that one of the most important tools I have is my Cycle Turn Indicator and that the most important timeframe is the intermediate-term. Basically, knowing the market's direction is as simple as following this indicator at the intermediate-term level. However, this does not mean that we can't use the long-term Cycle Turn Indicator, the Trend Indicators at the various levels, the cyclical structure of the market and the cyclical statistics as additional tools to further enhance our market analysis.
Should you be interested in analysis that provides intermediate-term turn points and covers the Dow theory and other price quantification methods, then please visit www.cyclesman.com for more details. A subscription includes access to the monthly issues of Cycles News & Views covering the stock market, the dollar, bonds and gold. I also cover other areas of interest at important turn points such as gasoline, oil, silver, the XAU and recently I have covered corn. I also provide updates 3 times a week plus additional weekend updates on the Cycle Turn Indicator on most all areas of concern. I also give specific expectations for turn points of the short, intermediate and longer-term cycles based on historical quantification.
By Tim Wood
Cyclesman.com
Tim Wood specialises in Dow Theory and Cycles Analysis - If you are interested in a statistical and technical based source that also utilizes Dow theory and provides statistical probabilities as to what should occur, then Cycles News & Views may be for you. I also provide web-based updates giving short and intermediate-term turn points on the stock market, gold, bonds and the dollar, utilizing my Trend and Cycle turn Indictors. A subscription also includes short-term updates three nights a week. Please see www.cyclesman.com/testimonials.htm .
© 2005-2022 http://www.MarketOracle.co.uk - The Market Oracle is a FREE Daily Financial Markets Analysis & Forecasting online publication.