


Our Asset Value Trend Dependent Economy
Economics / US Economy Dec 12, 2008 - 04:41 PM GMTBy: Tim_Iacono

 The Federal Reserve's latest Flow of Funds Report contains some painful news about how our asset-dependent economy is faring in what is now an increasingly asset-averse world. This time around we have double the trouble as prices for both stocks and housing are declining.
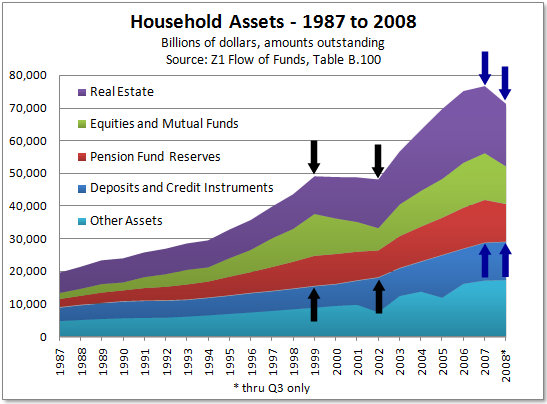
The two pairs of black arrows in the chart indicate how we made the nearly seamless transition from a stock market bubble to a housing bubble earlier in the decade. The overall value of assets just flat-lined there at around $50 trillion between 1999 and 2002 and then, when the housing bubble kicked into high gear, assets zoomed another $25 trillion higher.
Now, only a year or so into the bursting of the housing bubble, stocks have also headed south in sympathy, the total value of household assets having already dipped some $6 trillion from the peak of $78 trillion one year ago.
Things will certainly get worse when data for the current quarter is reported and who knows what the new year will bring, but it probably won't be good - at least for a while.
As for debt, overall household assets at $71 trillion still far exceeds overall household debt of just under $15 trillion, but it probably doesn't feel like we're $56 trillion ahead.
What it probably does feel like is what's depicted in the chart below - the tango between the value of household real estate assets and total mortgage liabilities. Note that a longer time scale version of this chart was posted hours ago by the always alert Calculated Risk along with a rather depressing image of what's happened to household percent equity, which just dipped below 45 percent.
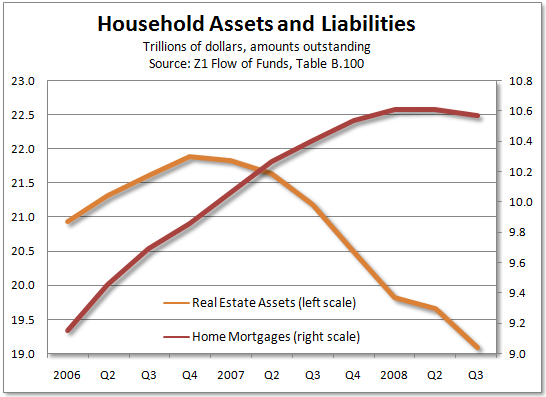
It's pretty clear where we go from here in the short-term (things get worse), but it will be interesting to see what happens to these curves over the next year or so.
By Tim Iacono
Email : mailto:tim@iaconoresearch.com
http://www.iaconoresearch.com
http://themessthatgreenspanmade.blogspot.com/
Tim Iacano is an engineer by profession, with a keen understanding of human nature, his study of economics and financial markets began in earnest in the late 1990s - this is where it has led. he is self taught and self sufficient - analyst, writer, webmaster, marketer, bill-collector, and bill-payer. This is intended to be a long-term operation where the only items that will ever be offered for sale to the public are subscriptions to his service and books that he plans to write in the years ahead.
Copyright © 2008 Iacono Research, LLC - All Rights Reserved
Tim Iacono Archive |
© 2005-2022 http://www.MarketOracle.co.uk - The Market Oracle is a FREE Daily Financial Markets Analysis & Forecasting online publication.