


Oversold Stocks Entering Seasonally Strong Time Period
Stock-Markets / Stocks Bear Market Feb 28, 2009 - 02:21 PM GMTBy: Mike_Burk

 The good news is: The market is deeply oversold as we enter a brief, but strong seasonal period.
Short Term - Most of the major indices had been down for 6 consecutive days through last Monday's low. Tuesday's rally was followed by 3 consecutive down days as of Friday's low. By virtually all breadth measures, the downside has been exhausted.
The chart below covers the past 3 months showing the S&P 500(SPX) in red and an indicator showing the ratio of NYSE advancing issues to advancing + declining issues (ADV / (ADV + DEC)). Dashed vertical lines have been drawn on the 1st trading day of each week and each month. Dashed horizontal lines have been drawn at 10% levels for the indicator.
The indicator hit its low for the period on February 18. It made a slightly higher low when the index hit a new low last Monday then it made a much higher low as the index hit a new multi year low on Friday.
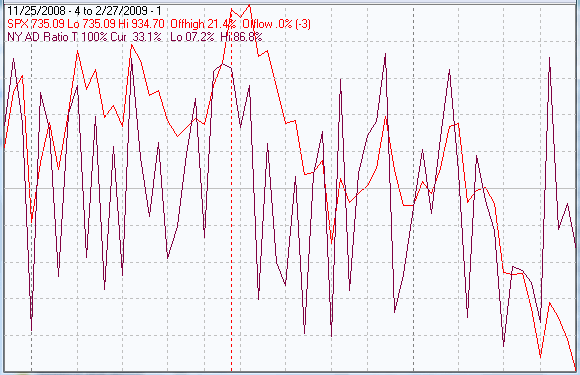
These progressive non confirmations are a positive. There are similar non confirmations from virtually all of the breadth derived indicators on both the NYSE and the NASDAQ.
Intermediate term
Last October 10 there were 2901 new lows on the NYSE, a record by any measure. On the November 20 retest there were 1894 new lows. A week ago Friday (February 20) there were 555 new lows and on Monday's low there were 395 new lows. At Friday's close, with the Dow Jones Industrial Average (DJIA) and SPX at a new multiyear lows, there were only 333 new lows. The 555 new lows on February 20, is enough to make another retest in the next few months very likely. In the shorter term, progressively fewer new lows as the indices decline, is a short term positive.
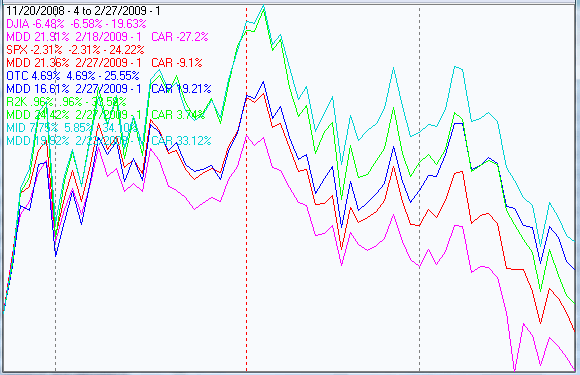
Since the November 20 low the secondaries have been outperforming the blue chips and that is a positive.
The chart below covers the period from the November 20 low through last Friday showing the major broad based indices on semi log scales.
The blue chip DJIA and SPX hit new multi year lows on Friday while the NASDAQ composite (OTC), S&P mid cap (MID) and Russell 2000 (R2K) remained above their November lows.
The annualized return for the indices since the November lows is:
| DJIA | -27.2% |
| SPX | -9.1% |
| OTC | +19.2% |
| R2K | +3.7% |
| MID | +33.1% |
Seasonality
Next week includes the first5 trading days of March during the 1st year of the Presidential Cycle.
The tables show the daily return on a percentage basis for the first 5 trading days of March during the 1st year of the Presidential Cycle. OTC data covers the period from 1963 - 2008 and SPX data from 1928 - 2008. There are summaries for both the 1st year of the Presidential Cycle and all years combined.
By all measures, next week has been positive and during the 1st year of the Presidential Cycle returns have been about double the average of all years combined.
In early March 1933 FDR, in the 1st year of his presidency, declared a 4 day bank holiday and the markets were closed as well as the banks. When the markets reopened on March 15, the DJIA jumped 15.34% and the SPX 16.61% in one day.
First 5 days of March.
The number following the year represents its position in the presidential cycle.
The number following the daily return represents the day of the week;
1 = Monday, 2 = Tuesday etc.
| OTC Presidential Year 1 | ||||||
| Day1 | Day2 | Day3 | Day4 | Day5 | Totals | |
| 1965-1 | 0.25% 1 | -0.23% 2 | -0.12% 3 | 0.21% 4 | -0.10% 5 | 0.00% |
| 1969-1 | -0.13% 1 | -0.16% 2 | 0.40% 3 | 0.07% 4 | -1.87% 5 | -1.70% |
| 1973-1 | -0.73% 4 | 0.49% 5 | 0.37% 1 | 1.13% 2 | 0.30% 3 | 1.55% |
| 1977-1 | 0.60% 2 | 0.05% 3 | 0.36% 4 | 0.57% 5 | 0.10% 1 | 1.68% |
| 1981-1 | 0.53% 1 | -0.36% 2 | 0.20% 3 | 0.15% 4 | 0.42% 5 | 0.95% |
| 1985-1 | 1.05% 5 | -0.03% 1 | 0.01% 2 | -0.57% 3 | -0.79% 4 | -0.34% |
| Avg | 0.26% | 0.00% | 0.27% | 0.27% | -0.37% | 0.43% |
| 1989-1 | 0.02% 3 | 0.68% 4 | 0.36% 5 | 0.56% 1 | -0.02% 2 | 1.61% |
| 1993-1 | -0.19% 1 | 1.23% 2 | 0.91% 3 | -0.47% 4 | 0.09% 5 | 1.58% |
| 1997-1 | 0.17% 1 | 0.40% 2 | 0.96% 3 | -1.03% 4 | -0.27% 5 | 0.22% |
| 2001-1 | 1.47% 4 | -3.01% 5 | 1.19% 1 | 2.87% 2 | 0.88% 3 | 3.40% |
| 2005-1 | 0.95% 2 | -0.18% 3 | -0.44% 4 | 0.59% 5 | 0.95% 1 | 1.87% |
| Avg | 0.48% | -0.18% | 0.60% | 0.51% | 0.33% | 1.74% |
| OTC summary for Presidential Year 1 1965 - 2005 | ||||||
| Averages | 0.36% | -0.10% | 0.38% | 0.37% | -0.03% | 0.99% |
| % Winners | 73% | 45% | 82% | 73% | 55% | 82% |
| MDD 3/2/2001 3.01% -- 3/7/1969 1.87% -- 3/7/1985 1.38% | ||||||
| OTC summary for all years 1963 - 2008 | ||||||
| Averages | 0.28% | -0.01% | 0.29% | -0.07% | -0.04% | 0.45% |
| % Winners | 64% | 50% | 70% | 58% | 51% | 63% |
| MDD 3/7/1980 7.49% -- 3/6/1968 4.86% -- 3/5/1982 3.43% | ||||||
| SPX Presidential Year 1 | ||||||
| Day1 | Day2 | Day3 | Day4 | Day5 | Totals | |
| 1929-1 | 0.94% 5 | -0.23% 6 | -1.09% 1 | -0.67% 2 | -1.58% 3 | -2.63% |
| 1933-1 | 1.94% 3 | -2.08% 4 | 3.36% 5 | 16.61% 3 | 1.76% 4 | 21.60% |
| 1937-1 | 0.00% 1 | 1.38% 2 | 1.15% 3 | -0.92% 4 | 1.31% 5 | 2.92% |
| 1941-1 | -0.20% 6 | -1.31% 1 | 0.51% 2 | -0.61% 3 | 1.95% 4 | 0.33% |
| 1945-1 | 0.14% 4 | -0.63% 5 | 0.00% 6 | 0.49% 1 | 0.49% 2 | 0.49% |
| Avg | 0.56% | -0.57% | 0.79% | 2.98% | 0.78% | 4.54% |
| 1949-1 | 0.62% 2 | -0.27% 3 | -0.14% 4 | 0.14% 5 | 0.95% 6 | 1.30% |
| 1953-1 | 0.12% 1 | 0.27% 2 | -0.85% 3 | 0.04% 4 | 0.19% 5 | -0.23% |
| 1957-1 | 1.11% 5 | 0.73% 1 | 0.36% 2 | 0.25% 3 | -0.27% 4 | 2.18% |
| 1961-1 | -0.02% 3 | 0.66% 4 | 0.16% 5 | 0.16% 1 | -0.91% 2 | 0.05% |
| 1965-1 | -0.21% 1 | 0.17% 2 | -0.16% 3 | -0.32% 4 | -0.21% 5 | -0.72% |
| Avg | 0.32% | 0.31% | -0.12% | 0.05% | -0.05% | 0.52% |
| 1969-1 | 0.25% 1 | 0.96% 2 | 0.39% 3 | -1.01% 4 | -0.05% 5 | 0.54% |
| 1973-1 | -0.56% 4 | 1.11% 5 | 0.36% 1 | 1.26% 2 | 0.31% 3 | 2.47% |
| 1977-1 | 0.84% 2 | -0.27% 3 | 0.49% 4 | 0.32% 5 | 0.05% 1 | 1.43% |
| 1981-1 | 0.56% 1 | -1.10% 2 | 0.23% 3 | -0.71% 4 | -0.06% 5 | -1.08% |
| 1985-1 | 1.13% 5 | -0.64% 1 | 0.09% 2 | -0.87% 3 | -0.63% 4 | -0.91% |
| Avg | 0.45% | 0.01% | 0.31% | -0.20% | -0.08% | 0.49% |
| 1989-1 | -0.61% 3 | 0.99% 4 | 0.42% 5 | 1.25% 1 | -0.32% 2 | 1.74% |
| 1993-1 | -0.31% 1 | 1.33% 2 | 0.30% 3 | -0.43% 4 | -0.27% 5 | 0.62% |
| 1997-1 | 0.57% 1 | -0.55% 2 | 1.40% 3 | -0.43% 4 | 0.80% 5 | 1.79% |
| 2001-1 | 0.10% 4 | -0.57% 5 | 0.59% 1 | 1.00% 2 | 0.65% 3 | 1.77% |
| 2005-1 | 0.57% 2 | -0.03% 3 | 0.03% 4 | 0.96% 5 | 0.26% 1 | 1.79% |
| Avg | 0.06% | 0.24% | 0.55% | 0.47% | 0.22% | 1.54% |
| SPX summary for Presidential Year 1 1929 - 2005 | ||||||
| Averages | 0.35% | 0.00% | 0.38% | 0.83% | 0.22% | 1.77% |
| % Winners | 65% | 45% | 75% | 55% | 55% | 75% |
| MDD 3/6/1929 3.52% -- 3/2/1933 2.08% -- 3/7/1985 2.03% | ||||||
| SPX summary for all years 1928 - 2008 | ||||||
| Averages | 0.22% | 0.17% | 0.19% | 0.18% | 0.00% | 0.75% |
| % Winners | 65% | 55% | 63% | 53% | 51% | 63% |
| MDD 3/7/1980 5.95% -- 3/6/1942 5.12% -- 3/6/1935 3.87% | ||||||
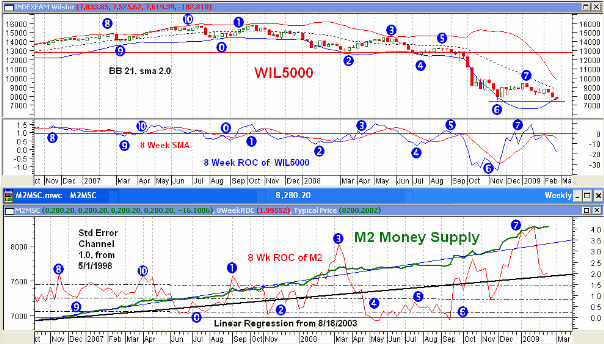
Money supply (M2)
The money supply chart was provided by Gordon Harms. Money supply growth has continued to level off.
March
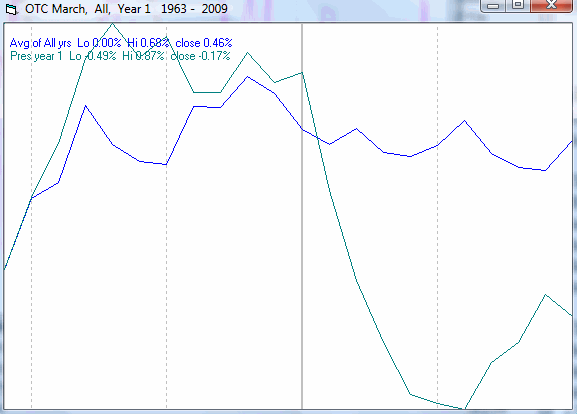
Since 1963 the OTC in March has been in the lower third of monthly performance averages, however, during the 1st year of the Presidential Cycle March is second only to February as the worst month of the year, up 36% of the time with an average return of -1.9%.
The average month has 21 trading days. The chart below has been calculated by averaging the daily percentage change of the OTC for each of the 1st 11 trading days and each of the last 10. In months when there were more than 21 trading days some of the days in the middle were not counted. In months when there were less than 21 trading days some of the days in the middle of the month were counted twice. Dashed vertical lines have been drawn after the 1st trading day and at 5 trading day intervals after that. The line is solid on the 11th trading day, the dividing point.
The blue line shows the average of all years since 1963 while the green line shows the average during the 1st year of the Presidential Cycle.
Since 1928 the SPX has been up 59% of the time in March with an average gain of 0.2% putting it ahead of February, May and September. During the 1st year of the Presidential Cycle the SPX has been up 50% of the time with an average loss of 0.4% putting it ahead of February, September and October.
The chart below is similar to the one above except it shows the daily performance over all years of the SPX in March in red and the performance during the 1st year of the Presidential Cycle in green.
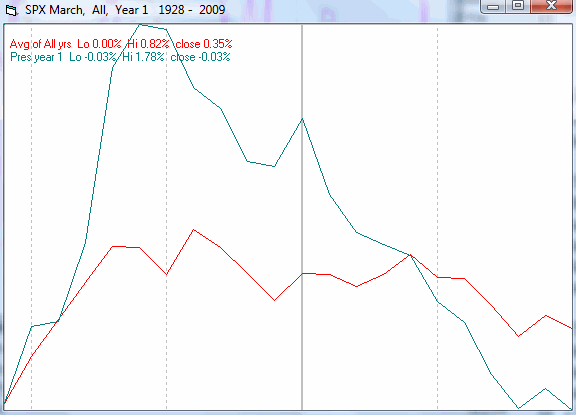
The March charts look very similar to the February charts, i.e., a sharp rally at the beginning of the month followed by a decline over the rest of the month.
Conclusion
The market is extremely oversold and followed the average seasonal pattern for February during the 1st year of the Presidential cycle very closely. Seasonally, next week has been, on average, strong. A bounce over the next week or so would fit the seasonal pattern and relieve the oversold condition. After that the seasonal pattern and the high level of new lows make new index lows likely.
I expect the major indices to be higher on Friday March 6 than they were on Friday February 27.
This report is free to anyone who wants it, so please tell your friends. They can sign up at: http://alphaim.net/signup.html . If you signed up in the past 3 weeks, you will have to do it again because the server ate all subscription applications during that period.
Last weeks positive forecast expecting a bounce from extremely oversold conditions was a miss.
Thank you,
By Mike Burk
To subscribe to this report : http://alphaim.net/signup.html
Gordon Harms produces a Power Point for our local timing group. You can get a copy of that at: http://www.stockmarket-ta.com/ .
Disclaimer: Mike Burk is an employee and principal of Alpha Investment Management (Alpha) a registered investment advisor. Charts and figures presented herein are believed to be reliable but we cannot attest to their accuracy. Recent (last 10-15 yrs.) data has been supplied by CSI (csidata.com), FastTrack (fasttrack.net), Quotes Plus (qp2.com) and the Wall Street Journal (wsj.com). Historical data is from Barron's and ISI price books. The views expressed are provided for information purposes only and should not be construed in any way as investment advice. Furthermore, the opinions expressed may change without notice.
Mike Burk Archive |
© 2005-2022 http://www.MarketOracle.co.uk - The Market Oracle is a FREE Daily Financial Markets Analysis & Forecasting online publication.