


Trading the Sun, Economic Rot and the Emerging Housing Stealth Bull Market
News_Letter / Stock Markets 2012 Apr 01, 2012 - 07:55 PM GMTBy: NewsLetter
 The Market Oracle Newsletter
March 12th, 2012 Issue #3 Vol. 6
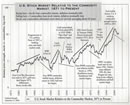
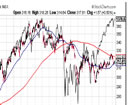
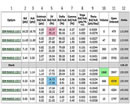
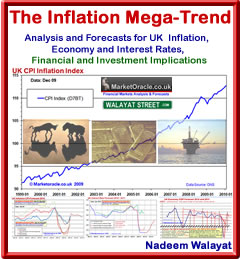
Trading the Sun, Economic Rot and the Emerging Housing Stealth Bull MarketStocks Stealth Bull Market 2011 Ebook Direct Download Link (PDF 2.8m/b) Interest Rate Mega-Trend Ebook Direct Download Link (PDF 2.3m/b) Inflation Mega-Trend Ebook Direct Download Link (PDF 3.2m/b) Dear Reader John Hampson of www.solarcycles.net has made available to our readers a 26 page analysis of the influence of the sun on the financial markets and the macro economy. Trading the Sun John writes: There is an 11-year (average) cycle of solar activity, measured in sunspots. Solar activity causes geomagnetic disturbance on Earth. The sun is also responsible for a cycle of nocturnal lunar illumination on Earth that lasts approximately a month. Psychological and behavioural research links geogmagnetism and lunar phasing with human mood, and sunspots with human excitability. Studies also link altered moods to more cautious behaviour, including financial decisions. In the last 150 years there have been several papers published demonstrating correlations between these natural phenomena and the financial markets and the macro economy. However, perhaps due a lack of scientific consensus over causality, solar phenomena remain niche disciplines in trading and economics, largely ignored by the financial and business media. In this document I will attempt to provide evidence that solar phenomena are the underlying cause of several financial and macroeconomic phenonema, and therefore deserving of a more central role in trading stocks and commodities. The broadly accepted classification of disciplines used in trading the financial markets is four-fold: (i) fundamental analysis including macroeconomics (ii) technical analysis, (iii) financial astrology and (iv) quantitative analysis. From (i) I will demonstrate the influence of solar phenomena on growth, inflation, demographics and asset cycles (stocks and commodities), and from (ii) I will explain how solar phenomena drive sentiment, stock market seasonality and waveform. I will also demonstrate the link between financial astrology and solar phenomena, and explain the decennial cycle. History Of Research In 1843 the German astronomer Schwabe discovered the solar sunspot cycle. By 1875 William S Jevons published his theory (1) that business cycles were related to these sunspot cycles, arguing that sunspot activity affected weather which affected agricultural output and prices which affected overall economic activity. As his supporting evidence contained flaws, he was largely discredited. However, Garcia-Mata and Shaffner (2) reworked Jevon’s theory in 1934 and concluded that there was a clear statistical correlation between the major cycles of non-agricultural business activity in the U.S. and the solar cycle. Meanwhile, Alexander Tchijevsky wrote the paper Physical Factors of the Historical Process (3). He compared sunspots records to major historical events in 72 countries from 500BC to 1922, and found a concentration around solar maximums. He divided the solar cycle into 4 periods and found correlations between human behavior and these periods: 1) a three year period of minimum activity characterized by passivity and autocratic rule; then 2) a two year period during which masses begin to organize under new leaders and one theme; followed by 3) a three year period of maximum excitability, revolution and war; and lastly 4) a three year period of gradual decrease in excitability until the masses are apathetic. He considered these variations as Mass Human Exitability. In 1965 Charles Collins found that, based on 93 years of data, a major stock market top is due when the average yearly number of sunspots rises to over 50 (4). Edward Dewey in 1968 found 43 activities that fluctuated with the sun’s 11 year cycle, including commodity prices, stock prices, banking activity, business activity, industrial production and agricultural productivity (5). Bryan Walsh wrote an article in the Cycles magazine in 1993 (6) putting some of Dewey’s claims to the test. By computing the rate of change in the geomagnetic field over the years (using the Ap index) together with the annual rates of for several measures of economic and financial performance (GNP, CPI, stock prices, gold price, bonds), he found the former led the latter by 6 to 12 months and had an average 65% correlation. Krivelyova and Robotti found strong empirical support in favour of a geomagnetic storm effect in stock returns after controlling for market seasonals and other environmental and behavioural factors (7). Regarding the sun’s illumination of the moon and its correlation with stock market returns, there have been several recent papers written. Illia Dichev and Troy Janes (8) demonstrated that stock returns in the 15 days around a new moon were around double those in the 15 days around full moons, for all major US stock indices (100 years data) and nearly all stock indices of 24 other countries studied (30 years data). K Yuan, L Zheng and Q Zhu (9) investigated the correlation between lunar phases and stock market returns for 48 countries and found that returns are lower around full moons and higher around new moons by 3-5% per annum, factoring out volatility, volume, and other calendar related phenomena. Marco Hickey (10) found positive correlation between 5 US stock indices and returns around new moons, and the inverse for the 10 year bond (using 10 years data). In recent years biological evidence has come to light that sunspots and solar cycles do impact humans physiologically, which are supportive of Tchijevsky’s earlier social studies. William Hrushesky, in his 2011 paper (11) noted slight elevations in oral temperature, pulse rate, blood pressure, and respiration rate and a slight decrease in the man’s maximum expiratory flow that peaked several months after the occurrence of solar sunspot maximum. To bring us right up to date, there is a growing body of evidence that geomagnetic field changes and sunspot maxima affect biological systems, and increasing psychological and biological evidence that the sun’s illumination of the moon affects human behaviour and mood. There are also electromagnetic theories of human consciousness – that consciousness is an electromagnetic phenomenon. However, these are areas in which there is as yet no overall scientific consensus. Here is a visual of the correlation between moon phase extremes and the S&P500 in 2010-2011:
The full analysis as contained in a 26 page PDF file (2meg) can be directly downloaded from the Market Oracle website - DOWNLOAD NOW (the pdf file will stay live until at least end of March 2012). U.S. Economy Rotting From Beneath Elliott Wave International present a free report on Economic Rot beneath the US Economy : Learn the truth about the flagging health of the U.S. economyThere's a lot about the U.S. economy most investors don't know. For instance, did you know...
There are two reasons why the mainstream financial media won't provide you with these insights: 1) because, frankly, they don't want you to know, and 2) because they don't know where to look. This brand-new report, FREE from Elliott Wave International, exposes the facts about the dire state of the U.S. economy. It delivers the charts, statistics and analysis politicians and central bankers don't want you to see -- unspun to show you the reality of the current investment climate. The only requirement is a valid email address. Bank of England Losing Control of Mortgage Interest Rates, Perversely Bullish for UK Housing Market? The Bank of England last week kept the UK Base interest rate on hold for a third year at 0.5%. The tax payer bailed out and supported banks answered by again announcing a series of mortgage interest rate hikes to take place over the coming months towards 5%, or ten times the official base interest rate.
In total the value of tax payer supported banker bailout liabilities extend to approx £4 trillion, which is about four times total UK public debt that the mainstream press and academics continuously obsess over. The banks continue to hold the country to ransom in a system that is in many ways just as corrupt as that which delivered Czar Putin another term in office in Russia or the Chinese revolving Communist Party Emperors. The banks dictate that they will continue to generate fraudulent tax payer funded profits so that they can continue to pay out bonuses. In fact as the recent announcements out of the likes of RBS have illustrated that even where losses are made after tax payer support the banks are still going to pay out bonuses any way, whilst the Bank of England watches on in silence as it stuffs the bankster's with ever more cash at every opportunity whilst continually pumping out deflation threat propaganda whilst all the while its real objective is for continuing high real inflation so as to achieve its objective of transferring wealth from workers, savers and bond holders onto bank balance sheets so as to prevent a chain reaction collapse of the financial system as well as financing of the government deficit and eroding the value of all debt (private and public). This is why the banks today are getting away with charging interest rates that are many multiples of the base interest rate and set to rise even further. The UK base rate is at 0.5% and the short interbank rates are around 1%. Instead credit worthy borrowers are being offered rates of 4%+ with savers typically less than 2% unless they opt to fix for multiple years. On face value the recent surge in UK interest rates could be taken as being disastrous for an already weak UK economy and housing market, which is the line that academic economists and the mainstream financial press have been following. Instead my analysis of the past 6 months has increasingly been acknowledging a slow drift towards normalisation of the financial system, despite having to endure stress as a consequence of the risk of financial armageddon emanating out of the euro-zone that still persists, and which in fact has intensified over the past 12months. So the picture is very complex and cannot be easily broken down into its component parts that would literally take a 100 page ebook to explain the tug of war processes's at work. However, as I mentioned earlier, rising interest rates are a NET positive for the UK economy which is despite a high probability of a recession this year for the UK (2 consecutive quarters of GDP contraction), which illustrates a messy big picture where it is very easy to push and paint a heavily doom laden scenario that I just don't see as being the most probable outcome. It has been a while since I last performed an in-depth analysis of the UK housing market which I last deemed to be in a continuing depression that would extend into to early 2012 following the crash of 2007-2009. Last forecast (03 Sep 2010 - UK House Prices and GDP Growth Trends Analysis) concluded in a continuing depression in the UK housing market for the next 3-4 years, with the most probable outcome being for a gradual shallow drift lower in prices over the next 1-2 years (6-12%), followed by a further 1-2 years of base building.
Therefore both my original analysis and emerging positive signs of the past 6 months are suggesting that I should now start to focus my attentions towards in-depth analysis of the UK housing market, which could perhaps converge towards a title such as " Stealth UK Housing Bull Market of 2012 to...", much as I wrote of the start of a Stealth bull market in Stocks in March 2009. This will require detailed and lengthy analysis so as to enable me to generate high probability trend trajectories, but again I am continuing to see increasingly positive signs which the mortgage rate hikes are just another step on the path towards a multi-year bull market, so I am giving you a head start on an emerging probable multi-year bull market in UK housing. Ensure you are subscribed to my always free newsletter to get my detailed analysis and precise trend forecasts in your email in box. Source and Comments: http://www.marketoracle.co.uk/Article33567.html By Nadeem Walayat Copyright © 2005-2012 Marketoracle.co.uk (Market Oracle Ltd). All rights reserved. Recent Featured Articles:
Nadeem Walayat has over 25 years experience of trading derivatives, portfolio management and analysing the financial markets, including one of few who both anticipated and Beat the 1987 Crash. Nadeem's forward looking analysis focuses on UK inflation, economy, interest rates and housing market. He is the author of three ebook's - The Inflation Mega-Trend; The Interest Rate Mega-Trend and The Stocks Stealth Bull Market Update 2011 that can be downloaded for Free.
Nadeem is the Editor of The Market Oracle, a FREE Daily Financial Markets Analysis & Forecasting online publication that presents in-depth analysis from over 600 experienced analysts on a range of views of the probable direction of the financial markets, thus enabling our readers to arrive at an informed opinion on future market direction. http://www.marketoracle.co.uk Disclaimer: The above is a matter of opinion provided for general information purposes only and is not intended as investment advice. Information and analysis above are derived from sources and utilising methods believed to be reliable, but we cannot accept responsibility for any trading losses you may incur as a result of this analysis. Individuals should consult with their personal financial advisors before engaging in any trading activities.
You're receiving this Email because you've registered with our website. How to Subscribe Click here to register and get our FREE Newsletter To access the Newsletter archive this link Forward a Message to Someone [FORWARD] To update your preferences [PREFERENCES] How to Unsubscribe - [UNSUBSCRIBE]
The Market Oracle is a FREE Financial Markets Forecasting & Analysis Newsletter and online publication. |
||||||||||||||||||||||||||||||||||||||||||||||||||
 The Bank of England over the past 4 years has effectively stuffed every bankster orifice with tax payer cash through a multitude of measures that include insuring toxic assets, direct capital injections, loans, transference of bad assets off bank balance sheets (such as Northern Rock) and QE money printing to buy assets owned by banks all as a consequence of the Fear of Financial Armageddon as I touched upon in depth in the Interest Rate Mega-trend ebook of March 2011.


© 2005-2022 http://www.MarketOracle.co.uk - The Market Oracle is a FREE Daily Financial Markets Analysis & Forecasting online publication.