


Analysis Topic: Stock & Financial Markets
The analysis published under this topic are as follows.
Sunday, February 17, 2019
Dow Jones Gann Angle Update / Stock-Markets / Stock Markets 2019
By: readtheticker
Let's review the Dow Jones Industrial Gann Angles and its secret sauce dominate cycle.
Dow Jones hit upper resistance Gann angle early 2019, a sell of followed, now the bounce works its way through the down ward Gann Angle, a fail at either make or break point will see the bounce sell off, and that may get very interesting!
Sunday, February 17, 2019
Here We Go – Get ready for the Stock Market Breakout Pattern Setup / Stock-Markets / Stock Markets 2019
By: Chris_Vermeulen
We are writing this post today with a few forward-looking expectations while attempting to warn traders that some extended rotation is likely to enter the markets over the next 30+ days. If you’ve been following our research, you’ll know that we’ve been calling these move months in advance of other researchers and analysts. Our September 17, 2018 research post highlighting our Adaptive Dynamic Learning predictive modeling system suggested the US stock markets were poised for a massive price rotation followed by a very unique price setup that we are experiencing now.
Read full article... Read full article...
Saturday, February 16, 2019
After 8 Terrific Weeks for Stocks, What’s Next? / Stock-Markets / Stock Markets 2019
By: Troy_Bombardia
It’s been a terrific 8 weeks for the stock market. If anything, this proves that in the stock market, an objective investor/trader needs to have a long term bullish bias.
Read full article... Read full article...
Saturday, February 16, 2019
What Could Happen When the Stock Markets Correct Next / Stock-Markets / Stock Markets 2019
By: Harry_Dent
 I hate to be so cynical, but the markets love to fool as many people as possible, bulls and bears alike. This is especially true at key turning points and even more so in extreme bubbles like the one we’ve been in since late 1994, with this final phase – and it’s unprecedented QE and tax cuts – since early 2009.
This final rally (since 2009) is all “hot air.”
This recovery has been the weakest ever in real GDP, capital spending, employment growth, and productivity (I’ll talk about this in more detail in the upcoming February edition of The Leading Edge).
Read full article... Read full article...
Friday, February 15, 2019
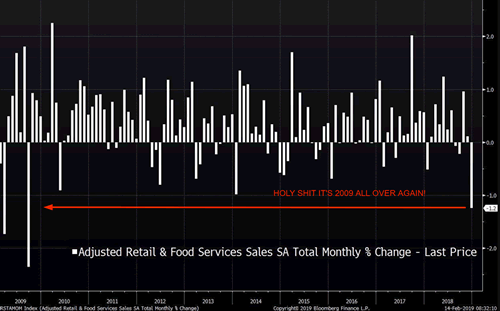
Retail Sales Crash! It’s 2008 All Over Again for Stock Market and Economy! / Stock-Markets / Stock Markets 2019
By: Troy_Bombardia
 On a slow moving day for the U.S. stock market, today’s big news is that “Retail Sales crashed, just like in 2008/2009!!!”. Financial media jumped all over this – nothing sells like bad news.
Friday, February 15, 2019
2019 Starting to Shine But is it a Long Con for Stock Investors? / Stock-Markets / Stock Markets 2019
By: Chris_Vermeulen
An odd thing happened at the beginning of 2019 for the markets – price levels across almost all sectors were deeply depressed as a result of the October through December 2018 price correction. We’re noticing that almost all sectors of the SP500 were relatively deeply depressed just before Christmas 2018 and the recent price rally has set up an interesting psychological phenomenon – a self-propelling bullish mantra for US Stocks.
Yes, 2018 ended with a drop – almost a CRASH. Yet, 2019 is starting off on a terror rally that is beginning to lay the grounds for a very dramatic Q1 and possibly Q2 recovery for many in the managed and passive funds. Remember the news in early January 2019? Hedge funds losing 12~22% or more for the 2018 end of year returns? Remember the feeling that these firms just couldn’t find any means of success when almost the entire 2018 year was mired in deep price rotations and sideways trading?
Read full article... Read full article...
Thursday, February 14, 2019
Will Stock Market 2019 be like 1999? / Stock-Markets / Stock Markets 2019
By: Troy_Bombardia
As the stock market pushes higher, the year “1998” keeps popping up in our market studies recently. 1998 saw a rapid stock market crash, a retest (something we have yet to see today), followed by a massive nonstop rally. Everyone at the time thought that the 1998 crash was the start of a much bigger crash. To their surprise, the bull market (already late-cycle) surged for another 1.5 years before topping.
There is indeed the possibility that today is similar to 1998. There are fundamental and technical parallels.
Read full article... Read full article...
Thursday, February 14, 2019
3 Charts That Scream “Don’t Buy Stocks” / Stock-Markets / Stock Markets 2019
By: John_Mauldin
In World War II, Nobel laureate Ken Arrow was assigned a team of statisticians to make long-range weather forecasts.
These people were some of the biggest math geniuses on the planet.
And yet, Arrow and his team soon realized that their forecasts were no better than a blind guess.
Seeing no value in their models, the team asked to be relieved of the duty.
The superiors replied: “The Commanding General is well aware that the forecasts are no good. However, he needs them for planning purposes.”
This story holds an important lesson about investing.
Thursday, February 14, 2019
Strategy Session - How This Stocks Bear Market Fits in With Markets of the Past / Stock-Markets / Stock Markets 2019
By: Plunger
 Question: Plunger you keep insisting that we are in a bear market. Really? The averages have done nothing but go straight up since December 24th. At this rate we will be at new highs within a month. I thought prices go down in a bear market! That’s not happening.
Answer: The most reliable method of forecasting the eventual outcome of the market over the past 118 years has been Dow’s Theory. It has withstood the test of time. It is not a short term predictor, instead it has been likened to a weather barometer. An instrument that forecasts changes in business conditions and market cycles. It is not useful in predicting short term fluctuations just like a weather barometer shouldn’t be used to forecast the amount of rain or snow to fall in an upcoming storm.
It is my contention that if one gets the big cycles right he has enabled the basic setup for success in the market. If you don’t understand the cycle and position yourself wrong in it, good luck trying to make money. So we stick to Dow Theory, it has proven to work in the past under all market conditions. What it says now is a bear market was triggered on December 14th 2019 which began on October 3rd 2019. The present 8 week rally is a secondary reaction which remains uncorrected. All rallies are corrected. We must be patient and observe the price action of the upcoming correction. In order to reverse the downward primary trend, the Dow and Transports must complete a downside correction of the existing rally then rally back above today’s present reaction high.
Read full article... Read full article...
Wednesday, February 13, 2019
A Stock Market Rally With No Pullbacks. What’s Next for Stocks / Stock-Markets / Stock Markets 2019
By: Troy_Bombardia
In a rally with no pullbacks, the S&P 500 has finally closed above its 200 day moving average (slightly).
Read full article... Read full article...
Tuesday, February 12, 2019
US Tech Stock Sector Setting Up for A Momentum Breakout Move / Stock-Markets / Tech Stocks
By: Chris_Vermeulen
Our research team has warned that the precious metals market would enter a 30~45 day rotational price trend on January 28, 2019. On January 16, 2019, we suggested that the upside price move in the US stock market had reached initial upside target zones and suggested that price pullback would be healthy near these levels. Today, we are warning that the markets are poised for a momentum breakout move that is setting up after the minor pullback in most US stock sectors the past week.
There are a number of news factors which support both or our analysis of the precious metals market and result in a failure of our analysis of the US stock market. First, the opportunity for the US government to agree to and pass a funding bill that removes uncertainty for many months. If the US government is able to pass a longer-term funding bill that eliminates pricing pressures and fears in the markets, the US stock market could breakout to the upside on a new momentum move very quickly. Second, if the US/China trade issues are resolved, in any substantial form, and trade begins to normalize over the next 6+ months, this could add even more fuel to the upside of the market and create a boost of momentum for almost all sectors.
Read full article... Read full article...
Monday, February 11, 2019
Powell's Interest Rate Hikes Pause Won’t Save Stocks / Stock-Markets / Stock Markets 2019
By: Michael_Pento
Jerome Powell threw Wall Street a lifeline recently when he decided to temporarily take a pause with the Fed’s rate hiking campaign. The Fed Head also indicated that the process of credit destruction, known as Quantitative Tightening, may soon be brought to an end. This move towards donning a dovish plume caused the total value of equities to soar back to a level that is now 137% of GDP. For some context, that valuation is over 30 percentage points higher than it was at the start of Great Recession and over 90 percentage points greater than 1985. So, the salient question for investors is: will a slightly dovish FOMC be enough to support the massively overvalued market?
The S&P 500 is now trading at over 16x forward earnings. But the growth rate of that earnings will plunge from over 20% last year to a minus 0.8% in Q1 of this year, according to FACTSET. It might have made sense to pay 19x earnings back in 2018 because it was justified by a commensurate rate of earnings growth. But only a fool would pay 16x or 17x earnings if growth is actually negative?
The only reason why that would make sense is if investors were convinced EPS growth was about to soar back towards the unusually-strong rate of growth enjoyed last year. And for that to be the case several stars have to align perfectly.
Read full article... Read full article...
Monday, February 11, 2019
Stocks Bouncing, but Will They Resume the Uptrend? / Stock-Markets / Stock Markets 2019
By: Paul_Rejczak
Stocks were mixed on Friday, as investors hesitated following Thursday's decline and a short-term profit-taking action. The S&P 500 index got closer to the 2,700 mark again last week. So is this just a downward correction or some new downtrend?
The U.S. stock market indexes were mixed between -0.3% and +0.1% on Friday, as investors hesitated following the Thursday's decline. The S&P 500 index broke above its short-term consolidation two weeks ago and it continued higher. The market got above the 61.8% Fibonacci retracement of its October-December downward correction of 20.2% (2,713.88), but then it retraced some of the advance. The Dow Jones Industrial Average lost 0.3% and the Nasdaq Composite gained 0.1% on Friday.
The nearest important resistance level of the S&P 500 index is at 2,720-2,725, marked by Thursday's daily gap down of 2,719.32-2,724.15. The resistance level is also at 2,740, marked by the local high. On the other hand, the support level is at 2,700-2,710, marked by the previous resistance level. The support level is also at 2,650.
Read full article... Read full article...
Monday, February 11, 2019
Stock Market Headwind of Fib Resistance Versus Tailwind of Fed-Speak: Which Will Win Out This Week? / Stock-Markets / Stock Markets 2019
By: Mike_Paulenoff
In last weekend's article, we focused on the relentlessly advancing S&P 500 (SPX) from its December 26 low at 2346.58 into an important Fibonacci price and time resistance zone at 2713.70 on January 31.
The 2713.70 level represented a 62% SPX recovery of the entire September-December decline, while January 31 represented day number 89 since the September 2018 all-time high, and the day that the December-January recovery rally time period equaled 38% of the overarching total timeframe from the September high.
Read full article... Read full article...
Monday, February 11, 2019
SPY : More Volatility to Come Due to the Market’s Nature / Stock-Markets / Stock Markets 2019
By: ElliottWaveForecast
Our observations of the ETF, SPY, on the monthly chart have us expecting a spike in Volatility. The inherent bullish nature of the Market calls for advances (motive waves) as trends and pullback (corrective waves) as countertrend. To add to that nature, Elliott Wave Theory always suggests one of the 3 motive waves within an advance will be extended. The strongest advance is most often the 3rd wave. SPY has traced out a very strong move since lows of 2009. Due to that extension it’s hard to find technical support to call for another similar rally.
In the monthly chart of SPY below the early stages of the advance from 2009 show what can be an Elliott wave “nest” as labeled I-II in red, then ((1)) –((2)) in black. Nested labeling is quite common at the start of very powerful impulsive motive waves.
Read full article... Read full article...
Monday, February 11, 2019
Stock Market Top Has Finally Arrived / Stock-Markets / Stock Markets 2019
By: Brad_Gudgeon
Last time I wrote, I thought a major stock market top was at hand. As it turned out I was early in my prediction. It looks as though Feb 5/6 is the long awaited B wave top. The chart below predicts SPX 2719 early Monday, followed by 2668 Tuesday and the 2510’s by Feb 19.Overall, I expect a repeat of Oct 1/3-Dec 24 from Feb 6- April 26 down into the SPX 2100’s. Late April into early June should see Wave A, Wave B into late August and then a final C Wave top in early October. It would not surprise me to see 3100 by early October 2019. The drop that follows into 2020 should be larger than the current one.
Read full article... Read full article...
Sunday, February 10, 2019
Stock Market Correction Starting? / Stock-Markets / Stock Markets 2019
By: Andre_Gratian
Current Position of the Market
SPX: Long-term trend – Long-term trend resuming?
Intermediate trend – Countertrend may be over.
Analysis of the short-term trend is done on a daily basis with the help of hourly charts. It is an important adjunct to the analysis of daily and weekly charts which discusses the course of longer market trends.
Daily market analysis of the short term trend is reserved for subscribers. If you would like to sign up for a FREE 4-week trial period of daily comments, please let me know at ajg@cybertrails.com
Correction starting?
Read full article... Read full article...
Sunday, February 10, 2019
Our Tech Stock Market Prediction – PART II / Stock-Markets / Tech Stocks
By: Chris_Vermeulen
If you missed PART 1 (SP500 Price Forecast) be sure to read it here.
Here is PART II let’s take a look at the NQ Weekly chart with the ADL predictive price modeling.
We are going to include predictions made by our Adaptive Dynamic Learning (ADL) price modeling system that originated from December 2017 going all the way forward through to the end of May 2019.
Read full article... Read full article...
Saturday, February 09, 2019
Stock Market Prediction – PART I / Stock-Markets / Stock Markets 2018
By: Chris_Vermeulen
As we enter the final stage of our market predictions from nearly 5 months ago, we thought it would be a good time to revisit these predictions and to update all of our followers with some timely and, apparently, accurate market data. We hope that many of you remember out predictions from September 2018 where we called for a 5~8% market decline, followed by a basing market headed into the November 2018 US elections, followed by a deep “Ultimate Low” price rotation before we called for an incredible upside price rally? The reason it is so important to watch for and understand all of our research is that we are attempting to provide great value and insight to our followers as well as help them protect their open positions from unknown risks.
As a bonus to all of this, we are going to include predictions made by our Adaptive Dynamic Learning (ADL) price modeling system that originated from December 2017 going all the way forward through to the end of May 2019. Can you imagine what it would be like to have a tool that could show you what is likely to happen going forward 6 months, 12 months or even 24 months into the future? Well, that is what we have with the ADL predictive price modeling system and we are going to show you how well it has been able to pick the future of the markets for the past 15+ months. Here we go.
Read full article... Read full article...
Friday, February 08, 2019
A Major Stocks Bear Market in 2020? / Stock-Markets / Stock Markets 2019
By: Troy_Bombardia
As the bull market and economic expansion ages, the current economic expansion is soon going to be tied for the longest economic expansion in history. Of course economic expansions and bull markets don’t die of old age – they die when leading economic indicators deteriorate significantly.
We are seeing signs of deterioration now, but they are not significant yet.
Read full article... Read full article...