


Analysis Topic: Stock & Financial Markets
The analysis published under this topic are as follows.
Friday, March 05, 2021
FED Balance Sheet Current State / Stock-Markets / Stock Market 2021
By: Nadeem_Walayat
Not to forget the inflation mega-trend courtesy of rampant central bank money printing to monetize government debt coupled with the fake inflation indices. So you really think US inflation is just 1%? it's more like 6%! Anyway the money printing binge now totals $7.4 trillion, up from $4 trillion at the start of 2020.
Read full article... Read full article...
Friday, March 05, 2021
US Treasury Yields Rally May Trigger A Crazy Ivan Event (Again) In Stock Market / Stock-Markets / Stock Market 2021
By: Chris_Vermeulen
Since shortly after the US November elections, my research team and I have been clear about our research and our belief that the bullish rally in the markets would continue to drive the strongest sectors higher and higher. In December 2020, we shared an article suggesting our proprietary Fibonacci Price Amplitude Arcs and GANN theory indicated a major price peak could set up in early April 2021. On February 3, 2021, we also published an early warning that Treasure Yields were set up to prompt a big topping pattern sometime over the next 6+ months . We followed that up with a February 21, 2021 article suggesting future Gold and Silver price trends may be tied to the moves in Treasury Yields and the resulting stock market trends.
Now that the Treasury Yields have completed what we suggested would be required to start a “revaluation event” in the stock market, we believe that a “Crazy Ivan” event may soon setup in the global markets. Many months back (August 28, 2019), we published an article about precious metals were about to pull a Crazy Ivan price event (https://www.thetechnicaltraders.com/precious-metals-crazy-ivan-followup/). This prediction came true in 2020 and 2021. Now, we are suggesting the global markets may pull a new type of Crazy Ivan event – a price revaluation event prompted by the rise in Treasury Yields.
Read full article... Read full article...
Thursday, March 04, 2021
Stocks, Gold – Rebound or Dead Cat Bounce? / Stock-Markets / Financial Markets 2021
By: Submissions
None of Friday‘s intraday attempts to recapture 3,850 stuck, and the last hour‘s selling pressure is an ill omen. Especially since it was accompanied by high yield corporate bondsh weakening. It‘s as if the markets only now noticed the surging long-end Treasury yields, declining steeply on Thursday as the 10y Treasury yield made it through 1.50% before retreating. And on Friday, stocks didn‘t trust the intraday reversal higher in 20+ year Treasuries either.
Instead, the options traders took the put/call ratio to levels unseen since early Nov. The VIX however doesn‘t reflect the nervousness, having remained near Thursday‘s closing values. Its long lower knot looks encouraging, and the coming few days would decide the shape of this correction which I have not called shallow since Wed‘s suspicious tech upswing. Here we are, the tech has pulled the 500-strong index down, and remains perched in a precarious position. Could have rebounded, didn‘t – instead showing that its risk-on (high beta) segments such as semiconductors, are ready to do well regardless.
That‘s the same about any high beta sector or stock such as financials – these tend to do well in rising rates environments. Regardless of any coming stabilization / retreat in long-term Treasury yields, it‘s my view that we‘re going to have to get used to rising spreads such as 2y over 10y as the long end still steepens. The markets and especially commodities aren‘t buying Fed‘s nonchalant attitude towards inflation. Stocks have felt the tremors, and will keep rising regardless, as it has been historically much higher rates that have caused serious issues (think 4% in 10y Treasuries).
Read full article... Read full article...
Wednesday, March 03, 2021
Stock Market Bull Trend in Jeopardy / Stock-Markets / Stock Market 2021
By: Troy_Bombardia
What a week it has been! Various markets saw noticeable declines on news of rising yields. The strong upward trend for stocks is finally taking a long-overdue breather and so is extreme sentiment.
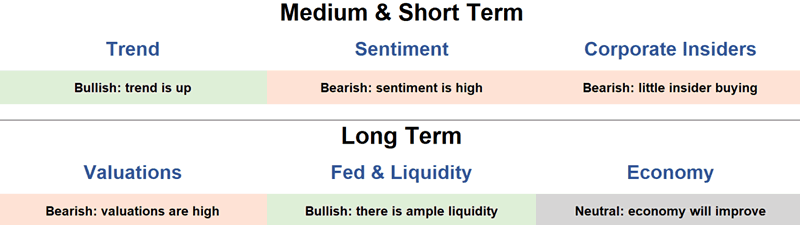
Let’s look at some bullish and bearish factors to give us a better idea of what the markets are doing.
Read full article... Read full article...
Friday, February 26, 2021
Congress May Increase The Moral Hazard Building In The Stock Market / Stock-Markets / Stock Market 2021
By: Avi_Gilburt
A few weeks ago, I wrote about the moral hazard being created by the Pavlovian buy-the-dip perspective in the market. As I expect the market to top out in the next few years and enter into a prolonged bear market, the nature of the market rallies over the last 10 years have thoroughly trained investors that all you have to do is buy-the-dip, as the market always comes back.
In fact, this past week, I saw these two comments in my articles, which only reinforces my perspective:
“I love a good press on an author from a paid subscriber but I’ve been making money hand over fist by trading and pouncing on pullbacks on a few stocks I closely watch. You have to have the time and you have to know the stocks well. Making much more money this way than I ever was buying/holding/speculating.”
Read full article... Read full article...
Thursday, February 25, 2021
The Everything Stock Market Rally Continues / Stock-Markets / Stock Market 2021
By: Troy_Bombardia
The market’s strong uptrend remains intact despite some lingering concerns about high valuations, extreme sentiment, and other overbought signals. Investors continue to pour into all markets (stocks, commodities, crypto etc.) with ever increasing liquidity.
Read full article... Read full article...
Wednesday, February 24, 2021
Is More Stock Market Correction Needed? / Stock-Markets / Stock Market 2021
By: Andre_Gratian
Current Position of the Market
SPX Long-term trend: There is some good evidence that we are still in the bull market which started in 2009 and which could continue into the first half of 2021 before coming to an end.
SPX Intermediate trend: May continue until SPX reaches ~4050-4150 (March 2021).
Analysis of the short-term trend is done daily with the help of hourly charts. They are important adjuncts to the analysis of daily and weekly charts which determine longer market trends.
Read full article... Read full article...
Wednesday, February 24, 2021
How to Protect Your Positions From A Stock Market Sell-Off Using Options / Stock-Markets / Options & Warrants
By: Chris_Vermeulen
Today we are going to explore how you can use options to hedge against a sudden market reversal. As you know I am going to be launching a new options service with an options specialist, Neil Szczepanski, shortly so you should start seeing more and more research on options from us.
The first question we need to answer is will there be a market sell-off? If we first look at the S&P chart below, we can see that we have had an incredible run. In order to determine if this trend is weakening, we need to look at what is happening with key sectors and sector rotation. Since the beginning of 2021, we have seen a rotation into commodity sectors which is typical of a late-cycle surge. This might give us a hint that higher volatility projections might be realized.
Read full article... Read full article...
Tuesday, February 23, 2021
For Stocks, has the “Rational Bubble” Popped? / Stock-Markets / Stock Market 2021
By: Paul_Rejczak
Matthew Levy writes: In keeping with last week’s theme, the market has mainly traded sideways this week. However, that correction I’ve been calling for weeks? We have potentially started.
While I don’t foresee a crash like we saw last March and feel that the wheels are in motion for a healthy 2021, I still maintain that some correction before the end of Q1 could happen.
Bank of America also echoed this statement and said last week that “We expect a buyable 5-10% Q1 correction as the big ‘unknowns’ coincide with exuberant positioning, record equity supply, and as good as it gets’ earnings revisions.”
Yes, the sentiment is still positive. That won’t change overnight. Vaccines seem more effective than we thought, especially against other variants of the virus. All that extra stimulus money and record low-interest rates could keep pushing stocks to more records and stimulate pent-up consumer spending. It’s not like the Fed is going to switch this policy up anytime soon, either.
Read full article... Read full article...
Monday, February 22, 2021
Stock Markets Discounting Post Covid Economic Boom / Stock-Markets / Stock Market 2021
By: Nadeem_Walayat
The stock market has continued to confound all of the doom merchants out there who blindly continue to point to the worst economic contraction since the great depression if not in history for most western economies. All whilst the Dow pushed its way to a new all time high into the end of 2020 and has continued to march ever higher during 2021 in response to which most investors have faced a barrage of that messages that the bubble is always about to burst, whilst my Patrons have received an unequivocal consistent message that this bull market has a long ways to go and that investors should not look a gift horse in the mouth when all of the stocks on my AI list were typically marked down by over 1/3rd against their Pre pandemic trading levels during March 2020.
Read full article... Read full article...
Monday, February 22, 2021
Pivotal Session In Stocks Bull Bear Battle / Stock-Markets / Stock Market 2021
By: Ricky_Wen
Wednesday’s session was more of the same as it was another expected consolidation. If you recall, it was only day #2 of the pattern so patience Is needed given the past 2 weeks’ V-shape performance totaling +8% from the 3650s low to the 3950s high on the Emini S&P 500 (ES).
Today should be an pivotal session given that both sides are trying to win the battle here. Bulls are trying to stabilize a temporary low so the train can finalize a route towards new all time highs again. Bears are trying to break below last week’s low and below the trending daily 20EMA to cause a derailment.
Read full article... Read full article...
Sunday, February 21, 2021
S&P 500 Correction – No Need to Hold Onto Your Hat / Stock-Markets / Stock Market 2021
By: Submissions
Yesterday‘s bearish price action in stocks was the kind of shallow, largely sideways correction I was looking for. Not too enthusiastic follow through – just rocking the boat while the S&P 500 bull run goes on. Stocks are likely to run quite higher before meeting a serious correction.
As I argued in yesterday‘s detailed analysis of the Fed policies, their current stance won‘t bring stocks down. But it‘s taking down long-term Treasuries, exerting pressure on the dollar (top in the making called previous Monday), and fuelling commodities – albeit at very differnt pace. The divergencies I have described yesterday, center on weak gold performance – not gaining traction through the monetary inflation, instead trading way closer in sympathy with Treasury prices.
Gold has frontrunned the other commodities through the corona deflationary shock, and appears waiting for more signs of inflation. It didn‘t make a final top in Aug 2020, and a new bear market didn‘t start. It‘s my opinion that thanks to the jittery Treasury markets, we‘re seeing these dislocations, and that once the Fed focuses on the long end of the curve in earnest, that would remove the albatross from gold‘s back.
Read full article... Read full article...
Sunday, February 21, 2021
Owning Real Assets Amid Surreal Financial Markets / Stock-Markets / Financial Markets 2021
By: MoneyMetals
In the current market environment, little else matters other than momentum. What’s moving up gets chased higher still by investors. And what can be moved up by any means is pursued by speculators who hope to jump-start a momentum trade.
It’s all being fueled by cheap money and government “stimulus.”
The consequences?
The U.S. stock market trades at an historically high premium to GDP (the so-called “Buffett indicator”).
Speculative trading frenzies in stocks such as GameStop defy any kind of fundamental analysis.
Read full article... Read full article...
Saturday, February 20, 2021
Is That the S&P 500 And Gold Correction Finally? / Stock-Markets / Stock Market 2021
By: Submissions
The stock bears finally showed they aren‘t an extinct species – merely a seriously endangered one. Yesterday‘s close though gives them a chance to try again today, but they should be tame in expectations. While there is some chart deterioration, it‘s not nearly enough to help fuel a full on bearish onslaught in the S&P 500. There is no serious correction starting now, nothing to really take down stocks seriously for the time being.
The Fed remains active, and monetary policy hasn‘t lost its charm (effect) just yet. Commodities and asset price inflation has been in high gear for quite some time, yet it‘s not a raging problem for the Main Street as evidenced by the CPI. Food price inflation, substitution and hedonistic adjustments in its calculation, are a different cup of tea, but CPI isn‘t biting yet.
Meanwhile, the real economy recovery goes on (just check yesterday‘s Empire State Manufacturing figures for proof), even without the $1.9T stimulus and infrastructure plans. Once we see signs of strain in the job market (higher participation rate, hourly earnings and hours worked), then the real, palpable inflation story can unfold. But we‘re talking 2022, or even 2023 to get there – and the Fed will just let it overshoot to compensate for the current and prior era.
Read full article... Read full article...
Friday, February 19, 2021
The Stock Market Big Picture / Stock-Markets / Stock Market 2021
By: Nadeem_Walayat
The stock market has continued to confound all of the doom merchants out there who blindly continue to point to the worst economic contraction since the great depression if not in history for most western economies. All whilst the Dow pushed its way to a new all time high into the end of 2020 and has continued to march ever higher during 2021 in response to which most investors have faced a barrage of that messages that the bubble is always about to burst, whilst my Patrons have received an unequivocal consistent message that this bull market has a long ways to go and that investors should not look a gift horse in the mouth when all of the stocks on my AI list were typically marked down by over 1/3rd against their Pre pandemic trading levels during March 2020.
Read full article... Read full article...
Friday, February 19, 2021
Three More Reasons We Love To Trade Options! / Stock-Markets / Options & Warrants
By: Chris_Vermeulen
Hi everyone, it’s me Neil Szczepanski again and I’m back to finish off telling you why I love to trade options! If you missed the first half of this article entitled “5 Reasons Why People Prefer To Trade Options Over Stocks” then click on the title to revisit it. In this second and final installment, I will walk through how adjustments and risk management of options can help give you better control of your trades and profits. I hope everyone enjoys the information and I look forward to helping everyone win with options trading!
REDUCE RISK
Everyone has heard a story about someone who mischaracterized or misunderstood their options trade, then having their account blow up when the underlying stock goes the wrong way. This happened recently with a Robinhood trader who woke up one morning to see his account at -$730,165. In this tragic event the kid took his life because he thought he had lost $730,165 and couldn’t reach his brokerage to understand his account. We learned later that the negative balance did not represent uncollateralized indebtedness at all, but rather his temporary balance until the stocks underlying his assigned options actually settled into his account. In short it was a delay in processing of the options contracts in his account, and not the actual trade that went awry. This is why it is very important that in this game of trading you get the proper training so you understand your risk. The risk is real.
Read full article... Read full article...
Friday, February 19, 2021
Stock Market March Melt-Up Madness / Stock-Markets / Stock Market 2021
By: Avi_Gilburt
March Madness is a term referring to the college basketball single-elimination tournament of 68 teams, leading up to the “Final Four,” from which the ultimate college basketball champion is determined. Most of the games take place during the last half of March, with the ultimate winner determined in early April.
But, I am seeing potential for a March Madness setup in the equity market as well.
While analyst and investor alike have been scratching their heads at the amazing market rally, we have seen since we struck the low back in March, I think many will be surprised at the next phase of the rally, which may actually be one of the strongest.
Read full article... Read full article...
Thursday, February 18, 2021
Why This "Excellent" Stock Market Indicator Should Be on Your Radar Screen Now / Stock-Markets / Stock Market 2021
By: EWI
"No crowd buys stocks of other countries intelligently"Elliott Wave International's 25+ analysts regularly review more than 100+ market indicators to keep subscribers ahead of major turns.
Many of those are "technical" indicators. Others are "sentiment" related.
Read full article... Read full article...
Thursday, February 18, 2021
S&P 500 Correction Delayed Again While Silver Runs / Stock-Markets / Financial Markets 2021
By: Submissions
The window of opportunity for the stock bears is slowly but surely closing down as Friday‘s gentle intraday peek higher turned into a buying spree before the closing bell. The sentiment readings and put/call ratio are at the greed, euphoric and compacent end of the spectrum again.
I asked on Friday:
(…) How long can it last, and what shape the upcoming correction would have? Right now, the warning signs are mounting, yet the bears shouldn‘t put all their eggs into the correction basket really, for it shapes to be a shallow one – one in time, rather than in price.
Today, I‘ll say that waiting for a correction is like waiting for Godot. Trust me, I have come to experience quite some absurd and Kafkaesque drama not too long ago. What an understatement.
One week ago, I called the dollar as making a local top, and look where we are in the process. Coupled with the steepening pace of rising long-dated Treasury yields, that‘s a great environment for financials (XLF ETF) as they benefit from the widening yield curve.
Read full article... Read full article...
Wednesday, February 17, 2021
Stock Market Trend Forecasts Analysis Review / Stock-Markets / Stock Market 2021
By: Nadeem_Walayat
The stock market has continued to confound all of the doom merchants out there who blindly continue to point to the worst economic contraction since the great depression if not in history for most western economies. All whilst the Dow pushed its way to a new all time high into the end of 2020 and has continued to march ever higher during 2021 in response to which most investors have faced a barrage of that messages that the bubble is always about to burst, whilst my Patrons have received an unequivocal consistent message that this bull market has a long ways to go and that investors should not look a gift horse in the mouth when all of the stocks on my AI list were typically marked down by over 1/3rd against their Pre pandemic trading levels during March 2020.
Read full article... Read full article...